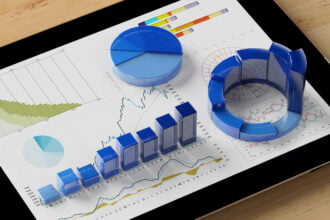
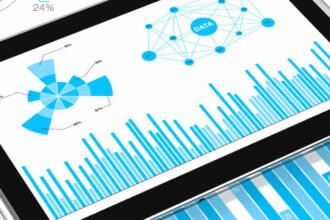
Big data has been incredibly important in the marketing profession. Marketers need to rely heavily on big data technology to reach customers more effectively.
Big data technology isn’t just important for making better insights. Those insights need to be presented in a format that is easy to conceptualize. Visual marketing dashboards are prime examples of using big data effectively in marketing.
In this day and age, all businesses must pay especially close consideration to the performance of their marketing metrics dashboard. They must make sure that their marketing strategy is operating effectively.
However, the question they have to ask is how they can evaluate their marketing efforts, whether social, digital, email, or even PR. This is complicated, because they all work well together. It is no longer safe to indulge in guesswork about marketing strategies. Key performance indicators are the most crucial metrics that serve as a compass for navigating the path forward on every marketing road map. Digital marketers who want to be part of this new data-driven reality and make their teams accountable must seek help with intuitive marketing dashboards to keep their team and strategy on track. In this article, we will discuss what l needs to be included in marketing reporting dashboards.
All about Dashboards:
Put in simple language, dashboards are marketing data analytics tools that collect and organizes KPIs. Key performance indicators are critical metrics and data that are easy to read and display for further analysis. Here the information is usually collected from multiple data sources. Most of the time, they are external and internal. These data metrics are displayed on the dashboard and can be viewed at any point in time and in real-time. Essentially, they act as real-time reports and helps in shaping business plans.
Marketing metrics dashboard:
A reporting tool displaying marketing analytics, KPIs, and metrics using data visualizations is a marketing dashboard. These dashboards are designed to provide teams with a real-time window into marketing performance. In simple terms, a marketing dashboard gives an idea about the performance of operations in a business. Marketing dashboards are in short marketing reports designed for continuous monitoring and broad distribution. It acts the same as a car’s dashboard. This report enables course corrections on an hourly, daily, monthly, quarterly and even yearly basis. Today, marketing dashboards and reports provide examples for tracking social media, advertising, email, SEO, website, and demand generation programs.
Benefits Of Using A Digital Marketing KPI Dashboard:
Dashboards for marketing metrics are helpful as they showcase soft metrics like awareness, engagement and interactions. However, today every business needs dashboards to display hard metrics like the internal rate of return followed by campaigns’ net present value. They are accompanied by online marketing metrics like bounce rate, total visits and click-through rates,. A marketing dashboard is the need of the hour.
Thus, marketing experts primarily focus on combining. Ideally, a strategy should be creative and forward-thinking, followed by relevant metrics and data that should back it. The bottom line is that every ad spend should be lucrative to the company at the end of the day.
Today, the best part is that marketing dashboards come with pre-loaded easy-to-understand graphs for visualizations, and they demonstrate crucial data. Below mentioned are the metrics:
- Soft metrics talk about customer satisfaction, engagements, and brand awareness.
- Hard metrics speak about inputs related to sales, revenue, conversions, and rate of return.
- Online marketing metrics describe cost-per-lead, new sessions, and click-through rates
Why Use Marketing Metrics Dashboards:
Digital marketing KPI dashboards are not just a pretty-looking display of critical data. It has a lot more to that. They are helpful in:
- Analyzing the metrics and key performance indicators.
- It is breaking down complex numbers for faster decision-making.
- Sharing inputs in an easy-to-understand format
- It allows showing the client that, as a marketer, you are in the right direction.
This gives a bird’s-eye view of the effectiveness of every campaign, ensuring to always have the bigger picture in the back of mind.
Below mentioned are the most useful KPIs to use in day to business:
- Organic Sessions
- Top Organic Landing Pages
- Organic Conversion Rate
- Top Organic Keywords
- Organic sessions by source
- Bounce rate
In the age of analytics, having plenty of data isn’t the same as having the information you can act on. To cite an example, keeping a count of your visitor and page clicks can be fun, but those numbers don’t always speak about how to generate more ROI out of your next marketing campaign. Setting up a marketing dashboard certainly makes it easier to decode data and use analytics effectively. When setting up a dashboard for the first time, ensure to calculate these metrics as they are the most critical components of a marketing metric dashboard:
- Traffic sources
- Cost of customer acquisition
- Social media reach
- Customer lifetime value
- CTA ? ClickThrough Rates
- Web traffic
- Bounce rates
- Social media impact
- Progress to the goal (monthly or quarterly)
- Landing page conversion
- Leads
- Email conversion rate
- Organic search
Marketing Dashboards Are Very Important Data-Driven Tools Companies Must Invest In
Big data has been very important for modern marketing. Marketing dashboards are a great example of the utilization of data analytics in the marketing profession. These key metrics give a sense of how well one is doing and drive accountability across the team. KPIs overview how well one is working toward goals, very much like a monitoring tool. Last but not least, marketing KPI’s justifies efforts as a whole. They offer a much rock-solid, quantifiable view which defines how well the marketing efforts are performing.


