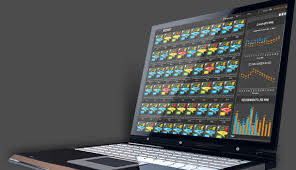
 VisualCue Technologies is a visualization tools that enables organisations to gain an understanding of their big data in the blink of an eye. They are able to present multi-dimensional data through intuitive symbols and icons. Using tiles that contain all the information required, Visual Cue triggers the natural human understanding to consume vast amounts of data throughout the entire organisation.
 VisualCue Technologies is a visualization tools that enables organisations to gain an understanding of their big data in the blink of an eye. They are able to present multi-dimensional data through intuitive symbols and icons. Using tiles that contain all the information required, Visual Cue triggers the natural human understanding to consume vast amounts of data throughout the entire organisation. In order to achieve this, they have developed easy to understand visualizations.
These visualizations present data from various sources in real-time in the dashboard, which enables decision-makers to see problems and opportunities. VisualCue has been developed for several years before they got their first customer: The Pentagon. Today they operate in numerous industries, some of which include: healthcare, finance, logistics, consumer goods/retail, education, call centers, e-commerce, etc.
Familiar objects are portrayed as icons, specific to the data that is analysed. These icons change colour or visibility according to predefined thresholds. This enables both business leaders as analysts to understand the data without the need of technical expertise. It can be applied to different departments, processes or physical assets. Users can sort, group and filter the data to be able to take action if required. The technology is also capable to show chronological or geospatial aspects as well for further understanding.
VisualCue Technologies was founded by Kerry Gilger, a former CEO of FYI Corporation. They have several patents pending but have not yet won any awards. Which is surprising as VisualCue is a simple and easy to understand visualisation tool that gives users great insights. They understand how to make large amounts of data understandable and therefore we give them a 7 bits rating.


