Transposing multiple columns to one row
name | age | sex | kg |
A | 10 | f | 30 |
B | 11 | f | 35 |
C | 12 | m | 33 |
Aage | Asex | Akg | Bage | Bsex | Bkg | Cage | Csex | Ckg |
10 | f | 30 | 11 | f | 35 | 12 | m | 33 |
- Transposing multiple columns to one row
- Multi-group transposition
- Inverse transposition
- Inserting a subtable with specified maximum length dynamically into the main table
- Complementing the missing months before transposition
- Transposition with dynamic locating
- Column-to-row transposition with three related tables

Multi-group transposition
dataset_date | f_site | ioh_kpi | idh_kpi | iol_kpi |
2015/04/21 13:15 | X6SF_SARF1 | 1 | 2 | 3 |
2015/04/21 13:30 | X6SF_SARF1 | 9 | 1 | 2 |
2015/04/21 13:45 | X6SF_SARF1 | 8 | 9 | 1 |
2015/04/21 14:00 | X6SF_SARF1 | 7 | 8 | 9 |
2015/04/21 13:15 | XC_01 | 2 | 3 | 4 |
2015/04/21 13:30 | XC_01 | 11 | 12 | 13 |
2015/04/21 13:45 | XC_01 | 21 | 22 | 23 |
2015/04/21 14:00 | XC_01 | 31 | 32 | 33 |
esProc script:

A2 gets the distinct dataset_date values, that is [“2015-04-21 13:15″,”2015-04-21 13:30″,”2015-04-21 13:45″,”2015-04-21 14:00”]. B2 gets field names of A1 starting from the third field, i.e. [“ioh_kpi”,”idh_kpi”,”iol_kpi”]. A3 creates a two-dimensional table dynamically, with field names being site,KPI Name,”2015-04-21 13:15″,”2015-04-21 13:30″,”2015-04-21 13:45″,”2015-04-21 14:00″. A4-B5 use a loop statement to append data; the statement is equal to A1.group(f_site).run(…), but it is more clear than run function when steps are many. Here’s the result:

Then you just need to perform a group by site and then create a simple table for reporting.
Inverse transposition
A query finds that the tb1 table has one record with many fields, as shown below:

project | operator1 | actionTime1 | operator2 | actionTime2 | operator3 | actionTime3 | poerator4 | actionTime4 |
A | Ashley | 20140404 | Rachel | 20150101 | Emily | 20140909 | Ashley | 20150225 |
You need to create a report with three columns and multiple rows, as shown below:
project | operator | actionTime |
A | Ashley | 20140404 |
A | Rachel | 20150101 |
A | Emily | 20140909 |
A | Ashley | 20150225 |

If there is more than one record in the tb1 table and each record has a different project, you need to use the following code:

Here’s the result:

Inserting a subtable with specified maximum length dynamically into the main table
tID | ApplicationName | User | Phone | Decline |
A01 | mfc | Bill | +70000000 | 1 |
A02 | mfc | John | +18761221 | 2 |
A03 | java | Jack | +8014001231 | 6 |
A04 | mfc | Tim | +008613133123 | 4 |
A05 | db | John | +18761221 | 8 |
qID | tID | status |
1 | A01 | yes |
2 | A01 | no |
3 | A01 | yes |
4 | A02 | yes |
5 | A03 | no |
6 | A04 | no |
7 | A04 | no |
8 | A05 | yes |
esProc script:

Create a two-dimensional table with fixed fields in A3; loop through each of A2’s groups to get the status value and complement the missing values to reach five; and then append the complete records to A3.

Complementing the missing months before transposition
time | quantity |
2014-01-01 15:20:25 | 3 |
2014-02-21 16:11:23 | 2 |
2015-01-05 11:14:21 | 1 |
2015-02-11 15:21:11 | 2 |
Month | Quantity in 2013 | Quantity in 2014 | Quantity in … |
esProc script:

A1 performs a SQL group and aggregate; A2 gets a list of years; A3 groups A1 according to the sequence of 12 months; A4 dynamically creates an empty two-dimensional table; A5 loops through every group of A3 and appends one record each time. Below is the result of A3:
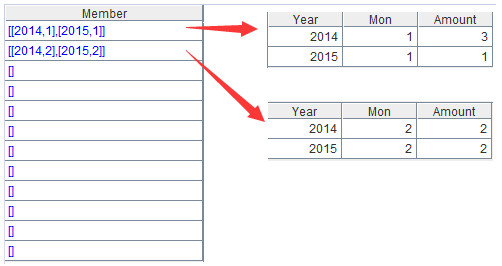
A4 gets the final result, as shown below:

Transposition with dynamic locating
userid | type | descr |
scooby | dog | dog |
scooby | weight | 50 |
scooby | hair | long |
mickey | mouse | mouse |
mickey | hair | |
mickey | weight | 2 |
userid | type | hair | weight |
mickey | mouse | 2 | |
scooby | dog | long | 50 |
esProc script:

The align function aligns data with members of a set ([‘hair’,’weight’]); @n means placing the unaligned data in a separate row. As with this example, such a row is composed of records corresponding to mouse and dog. Here’s the result:

Column-to-row transposition with three related tables
stu_id | stu_name | class_id |
1 | Ashley | 1-1 |
2 | Rachel | 1-1 |
3 | Emily | 1-3 |
stu_id | subject | score |
1 | java | 77 |
1 | c++ | 80 |
2 | java | 67 |
2 | c++ | 58 |
3 | java | 56 |
3 | c++ | 85 |
stu_id | subject | score |
2 | c++ | 78 |
3 | java | 82 |
stu_id | stu_name | java_score | c++_score | scoresSum | javaRetest | c++Retest |
1 | Ashley | 77 | 80 | 156 | ||
2 | Rachel | 67 | 58 | 125 | 78 | |
3 | Emily | 56 | 85 | 141 | 82 |
esProc script: