Last month I conducted a quick “flash survey” of my network to quantify the preferences of the Burtch Works network, and asked: Which do you prefer to use, R or SAS? I posted the initial results on my blog a few weeks ago, and as promised during the webinar for our Data Scientist Salary Study, we’ve finished up our deeper dive analysis of the data from over 1,000 respondents.
Last month I conducted a quick “flash survey” of my network to quantify the preferences of the Burtch Works network, and asked: Which do you prefer to use, R or SAS? I posted the initial results on my blog a few weeks ago, and as promised during the webinar for our Data Scientist Salary Study, we’ve finished up our deeper dive analysis of the data from over 1,000 respondents.
We were eager to see how the preferences of our network varied by years of experience, education level, industry and region, and you can find the results of our analysis in my latest blog post.
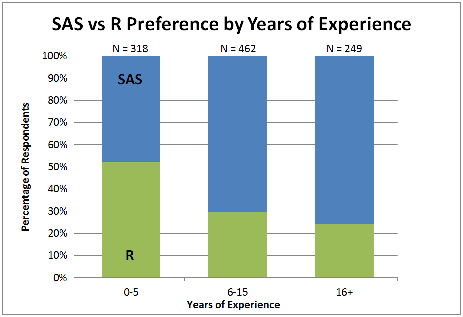
I know many of you were particularly interested to see how the data varied by years of experience, so here’s a sneak peek at the results:

Check out the blog post for the rest of the findings, and be sure to let me know what you think of the results!