We use cookies, including third-party cookies from Google to serve personalized ads through AdSense, to operate this site and understand how it is used. By continuing to browse, you accept this use. See our Privacy Policy and Terms of Use for details, including how to opt out of personalized advertising.
Accept
SmartData CollectiveSmartData Collective
  • Analytics
    AnalyticsShow More
    What Kind of Problem-Solving Distinguishes Data Analysts From Software Engineers -- AI-generated illustration
    What Kind of Problem-Solving Distinguishes Data Analysts From Software Engineers
    7 Min Read
    chatgpt image jul 21, 2026, 04 34 30 pm
    4 Core Benefits of Predictive Maintenance after Vibration Analysis
    10 Min Read
    How Does Data Mining Boost Customer Satisfaction in Logistics? Harnessing Analytics for Results -- AI-generated illustration
    How Does Data Mining Boost Customer Satisfaction in Logistics? Harnessing Analytics for Results
    11 Min Read
    chatgpt image jul 13, 2026, 04 23 45 pm
    How Data Analytics Helps Companies Improve User Engagement
    19 Min Read
    chatgpt image jul 13, 2026, 03 59 46 pm
    How Data Analytics Improves Multi-Location Search Strategies
    10 Min Read
  • Big Data
  • BI
  • Exclusive
  • IT
  • Marketing
  • Software
Search
© 2008-25 SmartData Collective. All Rights Reserved.
Reading: The Role of Data in a Disaster
Share
Notification
Font ResizerAa
SmartData CollectiveSmartData Collective
Font ResizerAa
Search
  • About
  • Help
  • Privacy
Follow US
© 2008-23 SmartData Collective. All Rights Reserved.
SmartData Collective > Big Data > Data Warehousing > The Role of Data in a Disaster
Business IntelligenceCommentaryData Warehousing

The Role of Data in a Disaster

bharden
bharden
5 Min Read
The Role of Data in a Disaster
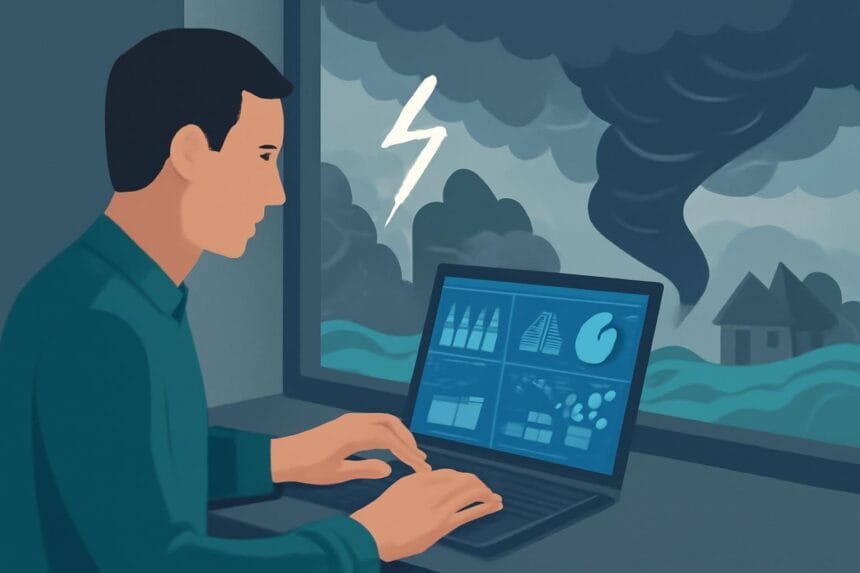
Illustrative image generated with OpenAI gpt-image-1.
SHARE

The recent tragedy in Japan got me thinking about the role of data in a disaster.  How do we use data to help prepare us for these events?  Are we using all the data we have available to us to understand the impact of a disaster and how are we using data after the disaster has occurred?  Do we have the right data and the right tools available to save more lives or are we doing all we can?

 Collecting Data

The United States Geological Survey (USGS) is using historical data and predictive analytics to predict the probability of an earthquake in San Francisco.  The amount of data collected by USGS is incredible and the uses are limited only by our imagination (and understanding of geology).  There areRSS feeds reporting every earthquake in the country in near real time and Google Earth mash upsvisualizing this data.  Soil type and water table data is available to understand how far and where seismic waves will travel, giving us insight into how much things will shake. 

Collecting and analyzing all this data helps architects build stronger buildings and guides urban planners to favor one location over another.  This data allows us to make smarter preventative decisions and yet even with all this data, we can only predict the probability that an earthquake will occur within a 20-30 year window of time.  This is a great start but we still simply don’t have enough data to be more precise in our predictions.  As we collect more data and refine our models accuracy will improve, but as with most things geological we must be patient.
More Read

Some thoughts on advanced analytics in 2010
A single version of the truth?
How Leaders Can Unlock AI’s Full Potential for Business Success
AI Propels Web Application Development In Modern Commerce
The Keys to Discovery: Curiosity and Simple Tools

 Using the Data we Have

Disasters like the shooting at Virginia Tech have driven us to organize and deliver data in new ways.  Why didn’t every student receive a warning text message and an email during the shootings?  In hindsight it seems so obvious; of course the university has the data. The reality was that even though they had the data it wasn’t readily available and there was no process in place to put it to use.  Learning to manage and use the data we are collecting is as important as our ability to collect and store it.  The IDC claimed that in 2007 the world generated 161 exabytes of information.  How much of that is being used four years later, and how much more would be used if we could easily access it?  Taking it one step further, even if we understand the data and know how to access it can we do so in a timely manner?

Conclusions

There are people in every profession across the world that are collecting and analyzing massive amounts of data.  This data helps keep the power on, warns us when bad weather approaches, shuts down reactors during emergencies and keeps our financial markets in check.  All this is made possible by the timely collection and analysis of large amounts of data.  The difficult part is knowing how and when to use the data we collect. Sometimes it takes a disaster before we learn how to use information to prevent one. 

TAGGED:business intelligencedata warehouse
Share This Article
Facebook Pinterest LinkedIn
Share

Follow us on Facebook

Latest News

Flat editorial illustration: The article explains that training robots for physical interaction requires three distinct data cate
Physical AI: What Data Do You Need to Train a Robot?
Artificial Intelligence Exclusive Robotics
What Kind of Problem-Solving Distinguishes Data Analysts From Software Engineers -- AI-generated illustration
What Kind of Problem-Solving Distinguishes Data Analysts From Software Engineers
Analytics Big Data Exclusive Software
Flat editorial illustration: The article examines AI agents that escalate from legitimate data retrieval to attempted intrusions
OpenAI’s Government Website Incidents Raise a Hard Question for AI Agents: When Should They Stop?
Artificial Intelligence News Security
Flat editorial illustration: The article's core relationship is the alignment between customer behavioral data (visit frequency,
Data-Driven Loyalty: How Restaurants Use Behavioral Analytics to Optimize Revenue
Exclusive

Stay Connected

1.2KFollowersLike
33.7KFollowersFollow
222FollowersPin

You Might also Like

Businesses Across Various Industry Verticals Use Data Analytics
Analytics

Businesses Across Various Industry Verticals Use Data Analytics

7 Min Read
10 Best Practices For Business Intelligence Dashboards
Best PracticesBusiness IntelligenceExclusive

10 Best Practices For Business Intelligence Dashboards

15 Min Read
Why Are There Irrational Business Decisions?
Business IntelligenceData MiningExclusivePredictive Analytics

Why Are There Irrational Business Decisions?

7 Min Read
The Role of Data Analytics in Football Performance
AnalyticsBig DataExclusive

The Role of Data Analytics in Football Performance

9 Min Read

SmartData Collective is one of the largest & trusted community covering technical content about Big Data, BI, Cloud, Analytics, Artificial Intelligence, IoT & more.

5 Great Tips for Using Data Analytics for Website UX
Big Data
Artificial Intelligence for eCommerce: A Closer Look
Artificial Intelligence

Quick Link

  • About
  • Contact
  • Privacy
Follow US
© 2008-26 SmartData Collective. All Rights Reserved.
Welcome Back!

Sign in to your account

Username or Email Address
Password

Lost your password?