
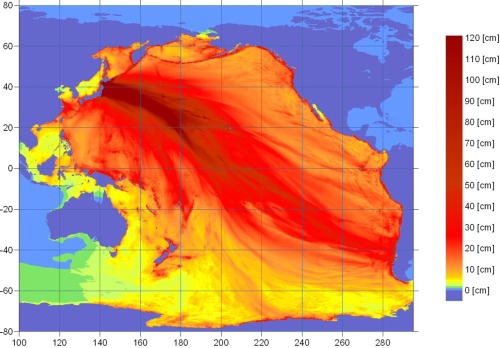
Visual data from Friday’s earthquake, this is the energy map from the huge quake and tsunami that hit Japan on March 11, 2011. (via poptech: nprinterns)
Visual data from Friday’s earthquake, this is the energy map from the huge quake and tsunami that hit Japan on March 11, 2011. (via poptech: nprinterns)


