We use cookies, including third-party cookies from Google to serve personalized ads through AdSense, to operate this site and understand how it is used. By continuing to browse, you accept this use. See our Privacy Policy and Terms of Use for details, including how to opt out of personalized advertising.
Accept
SmartData CollectiveSmartData Collective
  • Analytics
    AnalyticsShow More
    chatgpt image jul 21, 2026, 04 34 30 pm
    4 Core Benefits of Predictive Maintenance after Vibration Analysis
    10 Min Read
    How Does Data Mining Boost Customer Satisfaction in Logistics? Harnessing Analytics for Results -- AI-generated illustration
    How Does Data Mining Boost Customer Satisfaction in Logistics? Harnessing Analytics for Results
    11 Min Read
    chatgpt image jul 13, 2026, 04 23 45 pm
    How Data Analytics Helps Companies Improve User Engagement
    19 Min Read
    chatgpt image jul 13, 2026, 03 59 46 pm
    How Data Analytics Improves Multi-Location Search Strategies
    10 Min Read
    cybersecurity efforts
    How Behavioral Analytics and AI Are Redefining Cybersecurity for Boca Raton Businesses
    14 Min Read
  • Big Data
  • BI
  • Exclusive
  • IT
  • Marketing
  • Software
Search
© 2008-25 SmartData Collective. All Rights Reserved.
Reading: Data Quality Chill Factor
Share
Notification
Font ResizerAa
SmartData CollectiveSmartData Collective
Font ResizerAa
Search
  • About
  • Help
  • Privacy
Follow US
© 2008-23 SmartData Collective. All Rights Reserved.
SmartData Collective > Big Data > Data Quality > Data Quality Chill Factor
Big DataData ManagementData Quality

Data Quality Chill Factor

MIKE20
MIKE20
4 Min Read
Data Quality Chill Factor
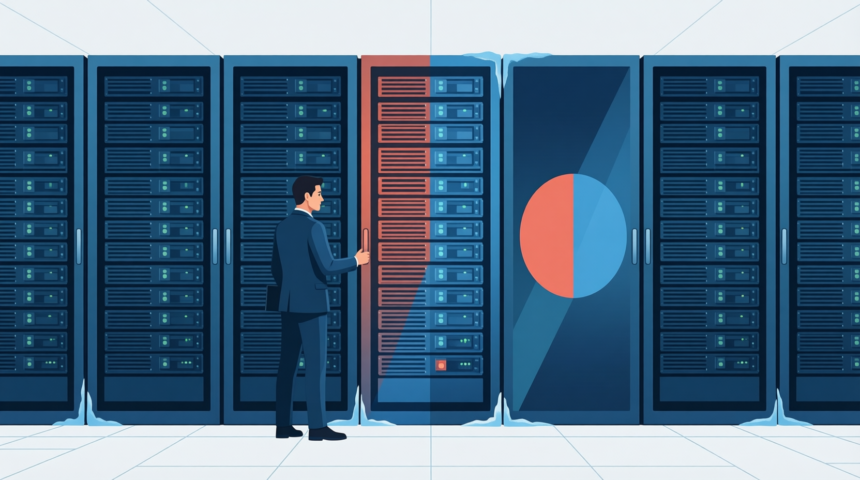
Illustration generated with Qwen Image.
SHARE

The recent North American cold wave that winded its way across Canada and the United States, brought heavy snowfall and broke low temperature records, leading to business, school, and road closures, as well as flight cancellations.

The recent North American cold wave that winded its way across Canada and the United States, brought heavy snowfall and broke low temperature records, leading to business, school, and road closures, as well as flight cancellations.  This polar vortex also spun the phrase wind chill factor into almost every conversation, prompting me to investigate how wind chill is calculated, and leading me to yet another cold contemplation of data quality.

Before we get to data quality, let’s begin with some chilling facts about wind chill factor.

Wind makes us feel cold because as it blows across the exposed surface of our skin, it draws heat away from our bodies.  When the wind picks up speed, it draws more heat away from exposed skin, cooling us more quickly.  Wind chill, therefore, calculates how rapidly body heat is lost at different wind speeds.

More Read

Data Lakes: Safe Way to Swim in Big Data?
Architecting Big Data Solutions
The Future of Customer Engagement Is Complicated
Proven VPN Protocols to Safeguard Your Data
Big Data Vs. Traditional Business Intelligence

Though not originally meant to express a temperature equivalent, weather forecasters started translating wind chills into the “feels like” factor we hear in weather reports today.  For example, I live in Iowa and at one point last week the air temperature was -3 degrees Fahrenheit, while the wind chill factor made it feel like -36 degrees Fahrenheit.

It’s also important to note that lower wind chills mean inanimate objects cool to the air temperature more quickly, but even high winds can’t force the object’s temperature below the air temperature.  For example, if the air temperature is 40 degrees Fahrenheit, water will not freeze even if the wind chill makes it feel to us like it’s below 32 degrees Fahrenheit (i.e., the freezing point of water).

What does Data Quality feel like?

All of this made me wonder if data quality has a chill factor.  Data quality metrics are analogous to air temperature, meaning they’re often an objective measurement of the quality of data.  A postal address, for example, can be validated independent of business context—it’s either valid or invalid.

However, what an invalid postal address feels like is dependent on a subjective measurement of business context.  An email marketing program, for example, would not care about the validity of postal addresses since its data usage has no exposed skin in the postal address game, so to speak.  Whereas a non-electronic billing system would feel the data quality chill factor of an invalid postal address.

Data quality standards are often established without acknowledging the different reference points from which they will be viewed, which could also influence how consistently standards are enforced.

If you want your organization’s data quality to be warm and cozy for all of your users, make sure you consider what data quality feels like from their business perspective, perhaps supplementing objective data quality metrics with a subjective data quality chill factor that’s customized for each user.

Share This Article
Facebook Pinterest LinkedIn
Share

Follow us on Facebook

Latest News

Synthetic Data vs Real Web Data: Comparison, Limitations, and Collection Methods  -- AI-generated illustration
Synthetic Data vs Real Web Data: Comparison, Limitations, and Collection Methods 
Big Data Exclusive
Illustration of mobile analytics dashboards with ad performance charts connected to backend databases
11 Best Sisense Alternatives for Embedded Analytics
Business Intelligence Exclusive
Analyst points at colorful circular data dashboard on screen - information technology business metrics
How Fragmented Workplace Tech Undermines Reliable Business Metrics and Reporting
Cloud Computing Exclusive Infographic IT
Using Multi-Source Data and Analytics to Detect Operational Drift Across Franchise Networks -- AI-generated illustration
Using Multi-Source Data and Analytics to Detect Operational Drift Across Franchise Networks
Exclusive Infographic

Stay Connected

1.2KFollowersLike
33.7KFollowersFollow
222FollowersPin

You Might also Like

Building Information Technology Liquidity
AnalyticsCloud ComputingCommentaryData WarehousingExclusiveRisk Management

Building Information Technology Liquidity

4 Min Read
Is that White Smoke Coming from your CRM System?
Big Data

Is that White Smoke Coming from your CRM System?

3 Min Read
Transform Training
Big DataWorkforce Data

7 Ways Big Data Can Transform Training

8 Min Read
7 Benefits of Managed Print Services for Data-Centric Companies
Big Data

7 Benefits of Managed Print Services for Data-Centric Companies

9 Min Read

SmartData Collective is one of the largest & trusted community covering technical content about Big Data, BI, Cloud, Analytics, Artificial Intelligence, IoT & more.

From Bolts to Bots: How AI Is Fortifying the Automotive Industry
Artificial Intelligence
5 Great Tips for Using Data Analytics for Website UX
Big Data

Quick Link

  • About
  • Contact
  • Privacy
Follow US
© 2008-26 SmartData Collective. All Rights Reserved.
Welcome Back!

Sign in to your account

Username or Email Address
Password

Lost your password?