Internet Topology: Massive and Amazing Graphs
I selected a few from this Google search. Which one is best? Re-usable in other contexts? What about videos showing…
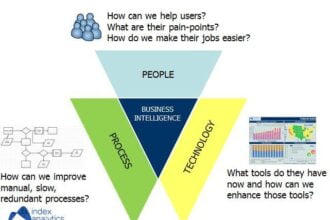
Business Intelligence Maturity Assessment: Data Visualization and Data Strategy Services
How do you assess the overall health and maturity of your Business Intelligence initiative? Big Data Analytics has recently received…
NCAA Data Visualizer for March Madness Face-Offs
If you're laying down a friendly bet on the March Madness games or just tweaking your fantasy roster, this NCAA…
Open Data App for the Paris Métro
When I lived in Paris years ago, I worked near Gare du Nord, but my friend Jenny lived near République.…
5 Principles of Analytical Hub Architecture (Part 1)
As I discused the other day in Why you need an analytical hub, enterprises need to spend time looking forward,…
R Script Creates a Map of Worldwide Email Traffic
The Washington Post reports that by analyzing more than 10 million emails sent through the Yahoo! Mail service in 2012,…
Big Data Analytics: The Four Pillars
Big data analytics is being offered as the key to addressing a wide array of management and operational needs across…
Stop Words for Social Media Analytics
Word Cloud is an important visualization technique in social media dashboards. In a glance, the stakeholder can see what their…
Big Data Robots: Are They After Your Job?
Put together robots with big data analytics and you have a powerful mix that could challenge us for most of…
6 Innovative Dashboards
Dashboards can be dull. Four or six charts laid out in a grid. All data, no explanation or logical flow.…


