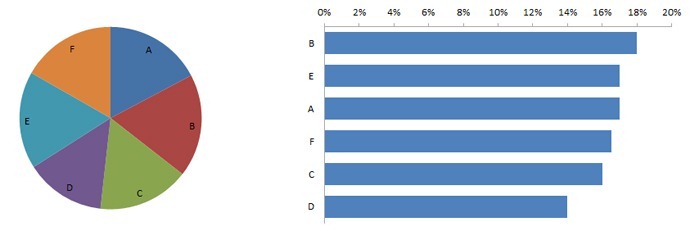
Which is better for communicating information: pie charts or bar charts? “Pie charts communicate information poorly… Our visual perception is not designed to accurately assign quantitative values to 2-D areas” says visualization expert Stephen Few in his book “Show Me The Numbers.”
The book backs up the claim with a compelling example that I’ve attempted to recreate below — which of these two charts do you find easier to interpret?

But recent research by Tufts University seems to make the answer less clear-cut.
Researchers monitored the brain activity of participants making a percentage estimation of a chart section compared to a previous chart, using both a bar chart and a pie chart. After examining all the data, their conclusion was that they rejected their “initial hypothesis that brain signals would indicate that bar graphs are easier to use for most people.”
Some participants said they found the task easier using bar charts and others found pie charts easier. This appeared to be backed up by both the observed brain activity and the reaction times and error rates of the two groups. However, the type of chart used didn’t seem to make a difference in terms of analysis performance: “despite a clear separation in brain activity between the bar high demand group and the pie high demand group, we observe very little difference in response time and error.” In addition, “there was no indication that either bar graphs or pie charts were superior across all participants on this particular task.”
Here is a short video summary of the study:
This is clearly one small study that concerned a particular (and potentially unusual) task, and should be considered in light of other research. But more data is better, and I would encourage you to spend as much time understanding what’s interesting about the study as you spend trying to figure out why you can disagree with it… I also hope that it might encourage more nuanced, less dogmatic discussions of data visualization best practice.