January saw Obama’s inauguration, and a reflection on Bush’s analytic legacy, a discussion on whether “gut feelings” have any basis in science, a dashboard showing the best companies to work for in the US, and a quick demonstration that Malcom Gladwell was right.

…

January saw Obama’s inauguration, and a reflection on Bush’s analytic legacy, a discussion on whether “gut feelings” have any basis in science, a dashboard showing the best companies to work for in the US, and a quick demonstration that Malcom Gladwell was right.

February’s posts discussed the power of having the right data, and that dashboards have been around for a long, long time, but if they have poor data it’s like putting lipstick on a pig, and that it would be a crime not to include analytics in applications — but also that we’re all really bad at making decisions.

March’s posts were about BI in Bahrain, Brussels, and on the Bosphorus, making tough decisions, BI incompetency centers, scandalous bankers making more money having a shower than the rest of us make in a year, the wonderful Innovation Center and Social Network Analyzer, and more problems with bad data.
April’s posts covered more news on the Social Network Analyzer, the importance of taking account risk in business intelligence, and how BusinessObjects users think they know everything.
May included a trip to Australia with presentations on why BI projects fail and what to do about it, BI competency centers, and transforming BI; the launch of Wolfram Alpha and the inevitable problem of semantics, the launch of BusinessObjects Explorer and a not-for-profit analytics example.
June saw posts on everything you ever wanted to know about Explorer, BI market shares, Gartner and collaborative decision-making, dispenser analytics, the end of LucidEra, and the start of Recovery Act analytics.

July saw some more great examples of government BI transparency, a fun opportunity to test your decision-making skills, predictions about the end of relational databases and augmented BI reality.
August saw presentations in Belgium and South Africa, the launch of SAP’s sustainability dashboards, and a discussion of whether anybody cares about BI market share.
September’s posts included the first BI Fails and BI Briefs, including my opinions on BI futures, why it’s important to have more than one KPI, and the most annoying business words of the year.
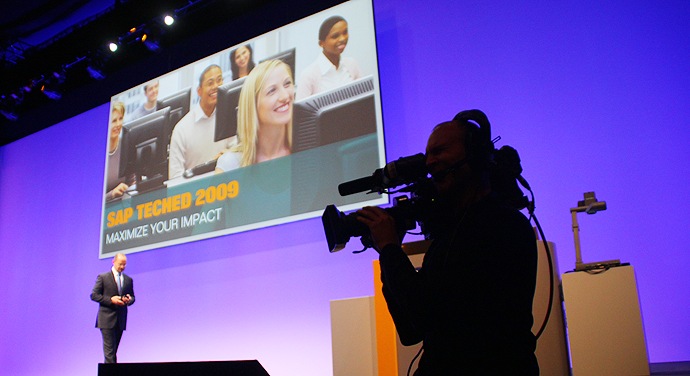
October’s posts included how to incorporate live twitter into PowerPoint using Xcelsius, the problems of manual analysis and justice, and highlights of SAP TechEd in Vienna.
November’s posts included how to use Twitter to surf through traffic, the death of OLAP, and tracking baby’s KPIs
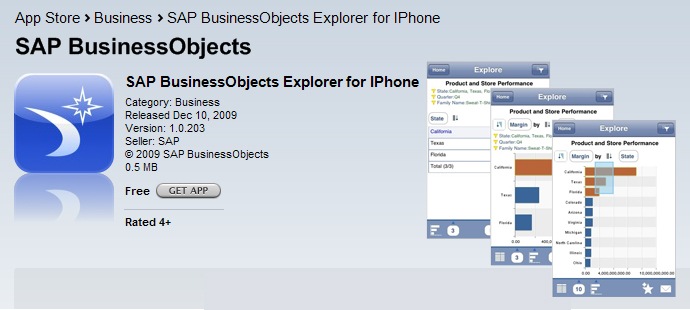
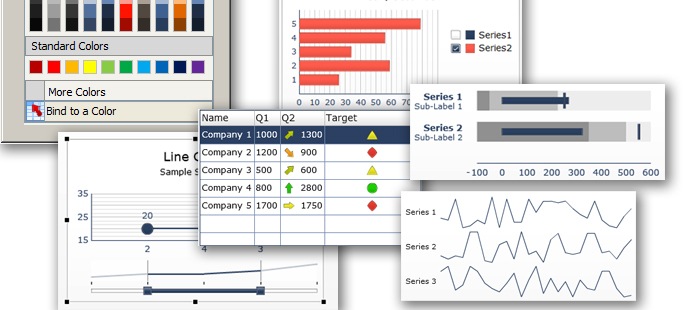
December saw Explorer for the iphone, the release of a new version of Xcelsius, some Season’s Greetings showing off the new features, and a great roundup of posts for the year.
Thank you for reading, and I look forward to 2010!
![]() Was this interesting? Share with others on Twitter with automatic URL shortening!
Was this interesting? Share with others on Twitter with automatic URL shortening!


![Enterprise-Social-Networking-Explore[2]](http://timoelliott.com/blog/wp-content/uploads/2009/03/enterprisesocialnetworkingexplore2.png)


