We use cookies, including third-party cookies from Google to serve personalized ads through AdSense, to operate this site and understand how it is used. By continuing to browse, you accept this use. See our Privacy Policy and Terms of Use for details, including how to opt out of personalized advertising.
Accept
SmartData CollectiveSmartData Collective
  • Analytics
    AnalyticsShow More
    Flat editorial illustration: The article is about joining public web signals with internal business metrics so BI teams can inter
    Alternative Data in BI: Bringing Public Web Data Into Your Dashboards
    23 Min Read
    Flat editorial illustration: The article is about automating the collection, preparation, and delivery of marketing data across p
    From Data to Dashboards: 5 Marketing Reporting Automation Software Picks
    12 Min Read
    Flat editorial illustration: The article contrasts passive follower totals with a behavioral path from attention and trust to cli
    Creator Analytics Beyond Follower Count: Seven Metrics That Measure Audience Behavior
    11 Min Read
    Flat editorial illustration: The article connects AI and marketing analytics with managerial judgment grounded in consumer behavi
    How an Online MBA in Marketing Connects AI and Data Analytics
    11 Min Read
    What Kind of Problem-Solving Distinguishes Data Analysts From Software Engineers -- AI-generated illustration
    What Kind of Problem-Solving Distinguishes Data Analysts From Software Engineers
    7 Min Read
  • Big Data
  • BI
  • Exclusive
  • IT
  • Marketing
  • Software
Search
© 2008-25 SmartData Collective. All Rights Reserved.
Reading: Bus commuting made tolerable with real-time data
Share
Notification
Font ResizerAa
SmartData CollectiveSmartData Collective
Font ResizerAa
Search
  • About
  • Help
  • Privacy
Follow US
© 2008-23 SmartData Collective. All Rights Reserved.
SmartData Collective > Big Data > Data Quality > Bus commuting made tolerable with real-time data
Data QualityData Visualization

Bus commuting made tolerable with real-time data

TeradataAusNZ
TeradataAusNZ
6 Min Read
Bus commuting made tolerable with real-time data
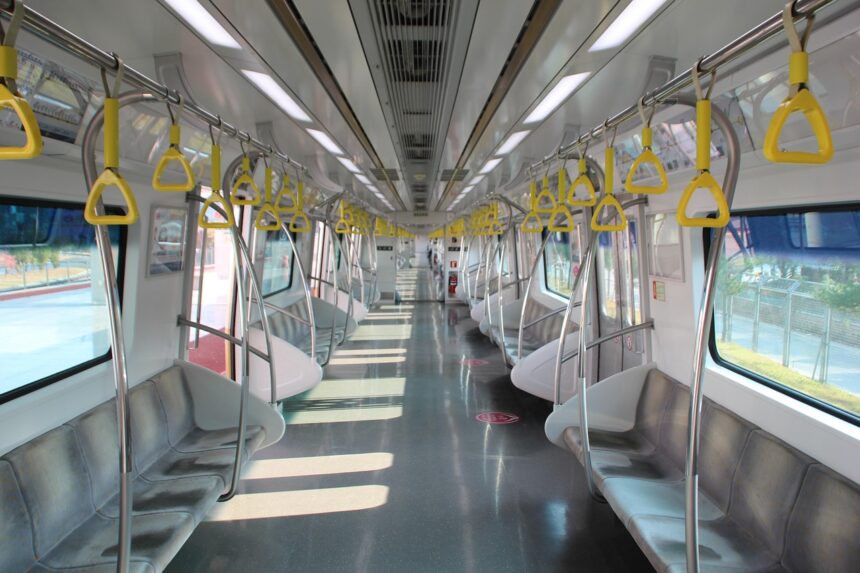
Photo by zheng2088 on Pixabay (https://pixabay.com/photos/subway-republic-of-korea-3436521/)
SHARE

Most of the whining and moaning about Sydney’s public transport is usually directed at the rail network. But just think a minute about having to commute by bus in Sydney to/from locations not serviced by trains – eg. the northern beaches. I have a long history bus commuting in Sydney so I am a qualified authority on the matter.

First of all you need to put up with a lot of old buses that leak and smell or you might get a new bus whose seats mistake your legs for sardines. Whichever bus you get, odds are you’ll be standing and wondering where your next molecule of oxygen is coming from as all the seated passengers keep the windows shut to keep the rain and wind out – and where do you put your bag? Try the laps of one of the seated enemy. Then your bus needs to deal with Sydney’s traffic…… Now’s about the time I start screaming.

On top of all this, before you even plan your commute, you need to navigate one of the most complex set of bus routes, timetables and numbering schemes known to man. And get this; even routes of the same number go to different destinations at different times of day. This system was not designed with simplicity as a driving principle.

But, after planning your trip and contemplating the “comfortable” journey ahead, you get to the worst bit: is the bus still coming or has it gone? Is it early or late? Is it on the road at all? Should I keep standing here in the rain and wait another 10 minutes for the next one or should I take the one that’s here now but goes to a slightly different place but might get me there faster? When the next one gets here, will it stop or will it be full and not allow me on? Gosh, I can’t wait to get to work and start my high-stress day in my high-stress job – then I’ll really be able to relax. Sydney’s traffic, bus congestion levels and other “Sydney” factors make relying on the buses a bit like relying on your cat to take out the garbage.

More Read

Beware of Big Data Technology Zealotry
Why we love these 5 data visualization tools (and you should, too!)
Forex Trading with R : Part 2
The Data Is In: Finding Affordable Car Loans
Big Analytics: Closing the ‘Clue Gap’ with Big Data

Not having up-to-the-minute information about where your bus is and when it is expected to arrive is the most annoying and frustrating aspect among all the challenges of bus commuting listed above. It is the one thing that has driven me, with rage, into a 2nd family car. Yes, I am one of those losers that sits in a 5-seater car on my own clogging up Sydney’s roads and doing my bit for global warming. If there was some real-time information guiding me and smoothing my daily commute then I probably would not have switched.

If all bus commuters had that real-time information, how much more efficiently would the bus network be used and how many more commuters would it attract? There is massive value to the state government even before you consider the benefits to the general community derived from happier bus commuters.

That is why when I read this newspaper article I was so disillusioned.

In summary, the article talks about how State Transit provided real-time bus location information for public consumption; a developer built an iPhone app to deliver the information out to passengers; the app then became so popular that State Transit had to shut down the data service because it couldn’t provide a “reliable and sustainable” feed.

No wonder there were 200,000 views in 2 weeks – the depth and the timeliness of the information, along with GPS and radio networks and mobile computing technology combine to provide a very powerful application. And with today’s technology and tools, it’s not really that hard to deliver.

Although, State Transit obviously found that sourcing and integrating the data, then making them available to service thousands of users with quick responses to many different types of targeted queries while minimising outages can be the hard bit …… that is, if you are using sub-standard database technology. If you are using database technology that scales linearly and is engineered from hardware components through to application layer to be highly resilient, then the “sustainable” part of the puzzle is solved. Add to that; parallel streaming data loading mechanisms, best-in-class query optimisation and workload management and the “reliable” part is also solved.

So come on State Transit, think outside the square and employ the right technology so you can turn that data hose back on again.

Get me back on the buses. 

 

Greg Taranto

Share This Article
Facebook Pinterest LinkedIn
Share

Follow us on Facebook

Latest News

Flat editorial illustration: The article connects downstream report failures, data-quality gaps, and conflicting metric definitio
Signs Your Data Architecture Needs an Outside Review
Big Data Exclusive
Data-Driven Pultrusion: Best GFRP Rebar Machines & ROI
Big Data Exclusive
Flat editorial illustration: The article contrasts tools for gathering fresh interviews with tools for analyzing existing qualita
10 AI Market Research Tools That Turn Qualitative Data into Insights
Artificial Intelligence Big Data Exclusive
Flat editorial illustration: The article compares proxy MCP servers by what an AI agent can do through them: manage proxy account
Proxy MCP Servers: 7 Options and What Each Lets an AI Agent Do
Artificial Intelligence Big Data Data Collection

Stay Connected

1.2KFollowersLike
33.7KFollowersFollow
222FollowersPin

You Might also Like

niche data tactics for business success
Big Data

Niche Data Tactics to Take Your Business to the Next Level

6 Min Read
What's up with Watson?: Responses to comments in Wall Street Journal
Data QualityMarketing

What’s up with Watson?: Responses to comments in Wall Street Journal

6 Min Read
Political Revolutions on Twitter, Visualized with R
Data VisualizationR Programming Language

Political Revolutions on Twitter, Visualized with R

3 Min Read
America’s Favorite Pastime is Having a Data-Driven Renaissance
AnalyticsBig DataBusiness IntelligenceCRMData Visualization

America’s Favorite Pastime is Having a Data-Driven Renaissance

8 Min Read

SmartData Collective is one of the largest & trusted community covering technical content about Big Data, BI, Cloud, Analytics, Artificial Intelligence, IoT & more.

Chatbots and SEO: How Can Chatbots Improve Your SEO Ranking?
Artificial Intelligence Chatbots Exclusive
AI chatbots
AI Chatbots Can Help Retailers Convert Live Broadcast Viewers into Sales!
Chatbots

Quick Link

  • About
  • Contact
  • Privacy
Follow US
© 2008-26 SmartData Collective. All Rights Reserved.
Welcome Back!

Sign in to your account

Username or Email Address
Password

Lost your password?