
We use cookies, including third-party cookies from Google to serve personalized ads through AdSense, to operate this site and understand how it is used. By continuing to browse, you accept this use. See our Privacy Policy and Terms of Use for details, including how to opt out of personalized advertising.
Accept
SmartData CollectiveSmartData Collective
  • Analytics
    AnalyticsShow More
    What Kind of Problem-Solving Distinguishes Data Analysts From Software Engineers -- AI-generated illustration
    What Kind of Problem-Solving Distinguishes Data Analysts From Software Engineers
    7 Min Read
    chatgpt image jul 21, 2026, 04 34 30 pm
    4 Core Benefits of Predictive Maintenance after Vibration Analysis
    10 Min Read
    How Does Data Mining Boost Customer Satisfaction in Logistics? Harnessing Analytics for Results -- AI-generated illustration
    How Does Data Mining Boost Customer Satisfaction in Logistics? Harnessing Analytics for Results
    11 Min Read
    chatgpt image jul 13, 2026, 04 23 45 pm
    How Data Analytics Helps Companies Improve User Engagement
    19 Min Read
    chatgpt image jul 13, 2026, 03 59 46 pm
    How Data Analytics Improves Multi-Location Search Strategies
    10 Min Read
  • Big Data
  • BI
  • Exclusive
  • IT
  • Marketing
  • Software
Search
© 2008-25 SmartData Collective. All Rights Reserved.
Reading: How to Track Your Data for Six Sigma Use
Share
Notification
Font ResizerAa
SmartData CollectiveSmartData Collective
Font ResizerAa
Search
  • About
  • Help
  • Privacy
Follow US
© 2008-23 SmartData Collective. All Rights Reserved.
SmartData Collective > Analytics > How to Track Your Data for Six Sigma Use
Analytics

How to Track Your Data for Six Sigma Use

knowwareman
knowwareman
4 Min Read
How to Track Your Data for Six Sigma Use
Photo by Tama66 on Pixabay (https://pixabay.com/photos/railway-rails-track-train-2439189/)
SHARE

While most companies have too much data, people can always identify something they aren’t tracking that they should be tracking. Then they think they have to set up a whole system to collect the measurement. This is a mistake. You don’t know if the measurement is useful until you have collected some. Rather than wait for a measurement system, start today using the simplest of tools: a checksheet.

I’ve use these kinds of checksheets when I’m working with a team to implement Six Sigma. They find causes, I write them down and tally the number of times each occur. By the 30th data point, a pareto pattern appears that points us at the most common (i.e., root) cause of the problem.

Checksheet Data Collection
Nothing could be simpler than data collection with a checksheet. The QI Macros have a template in the improvement tools to get you started:

More Read

Breaking Analytics Out Of The Box - Literally
Breaking Analytics Out Of The Box – Literally
Deliver an Excellent Customer Experience Using Big Data
Target, Pregnancy, and Predictive Analytics – Part I
Teaching Big Data Analytics During Lockdown
Department of State’s Consular Systems and Technology: A Track Record of Innovation

Simply print it out and start writing on it. What to write?

  • In column A, write the first instance of any defect, problem or symptom you detect. For example, if someone is calling us for support and they have a problem with understanding GageR&R, then we’d write “GageR&R” in A3 and put a stroke tally in the day of the week (e.g., Monday):
  • Then continue as the week goes on, adding defects, problems or symptoms. By the end of the week, we’ll have an interesting picture of support calls.

Just add up the number of calls and “Excel disabled macros ” jumps out as the majority of the calls. Create a pareto chart to better demonstrate this.

But now the questions arise:

  • Does a specific version of Excel disable the macros?
  • What are the SPC Questions about? Histograms? Control Charts? Which control chart?
  • And so on.

Well, if we spent a lot of time and money setting up a measurement system to track just these items, it wouldn’t do us much good. Now we can tune up the checksheet to give us better data:

Use a checksheet to prototype your data collection efforts. Iterate until you start to understand what you really need to know to make improvements. A series of checksheets may be all you need to solve a pressing problem. If necessary, you can implement a measurement system to collect the data over time.

So please, don’t wait for a magical, all encompassing measurement system to deliver data. It’s not going to happen. And I often find it’s just an excuse to avoid making improvements (“I can’t because I don’t have the measurements I need.”) 

TAGGED:datadata collectionsix sigma
Share This Article
Facebook Pinterest LinkedIn
Share

Follow us on Facebook

Latest News

Flat editorial illustration: The article's core relationship is workload-by-workload decision-making for cloud migration, where s
Which Workloads Should Move to the Cloud?
Cloud Computing Exclusive IT
Flat editorial illustration: The article positions data governance as a strategic board-level concern rather than a purely techni
Why Data Governance Is Becoming a Board-Level Business Priority
Big Data Exclusive Policy and Governance
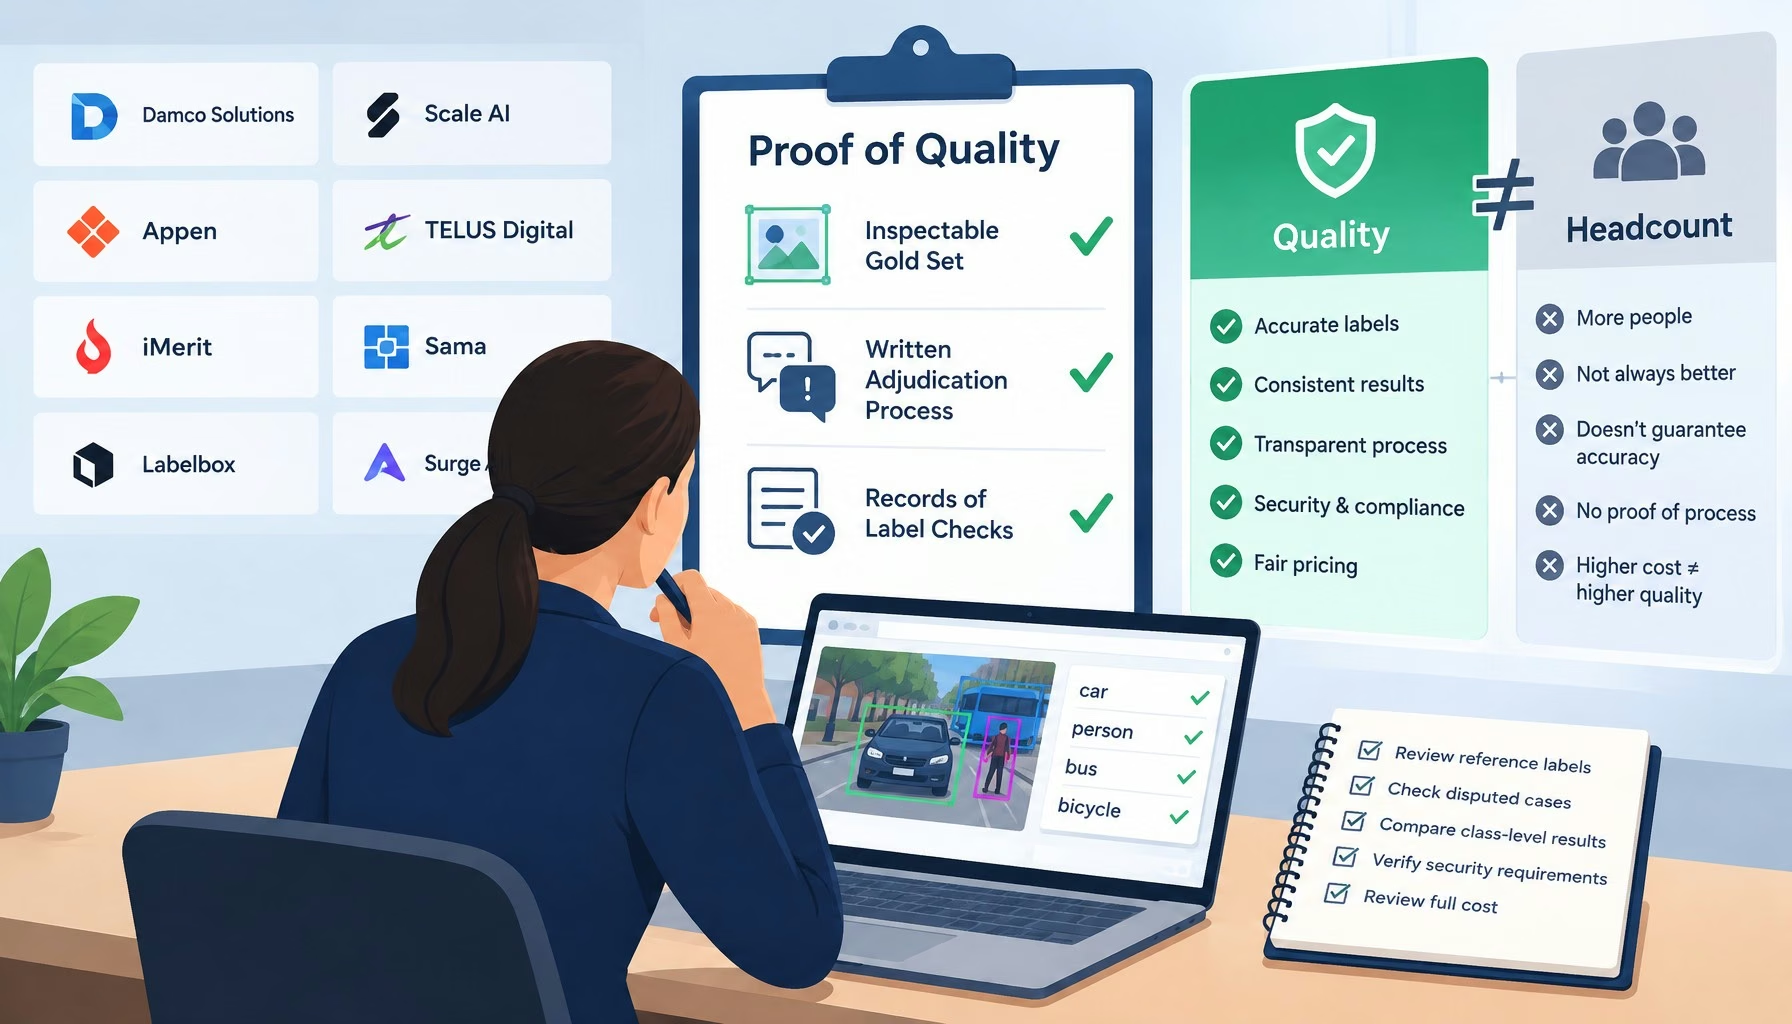
Flat editorial illustration: The article argues that data annotation quality should be measured by inspectable gold sets, written
The Top Data Annotation Companies Are Separated by Proof of Quality, Not Headcount
Big Data Exclusive
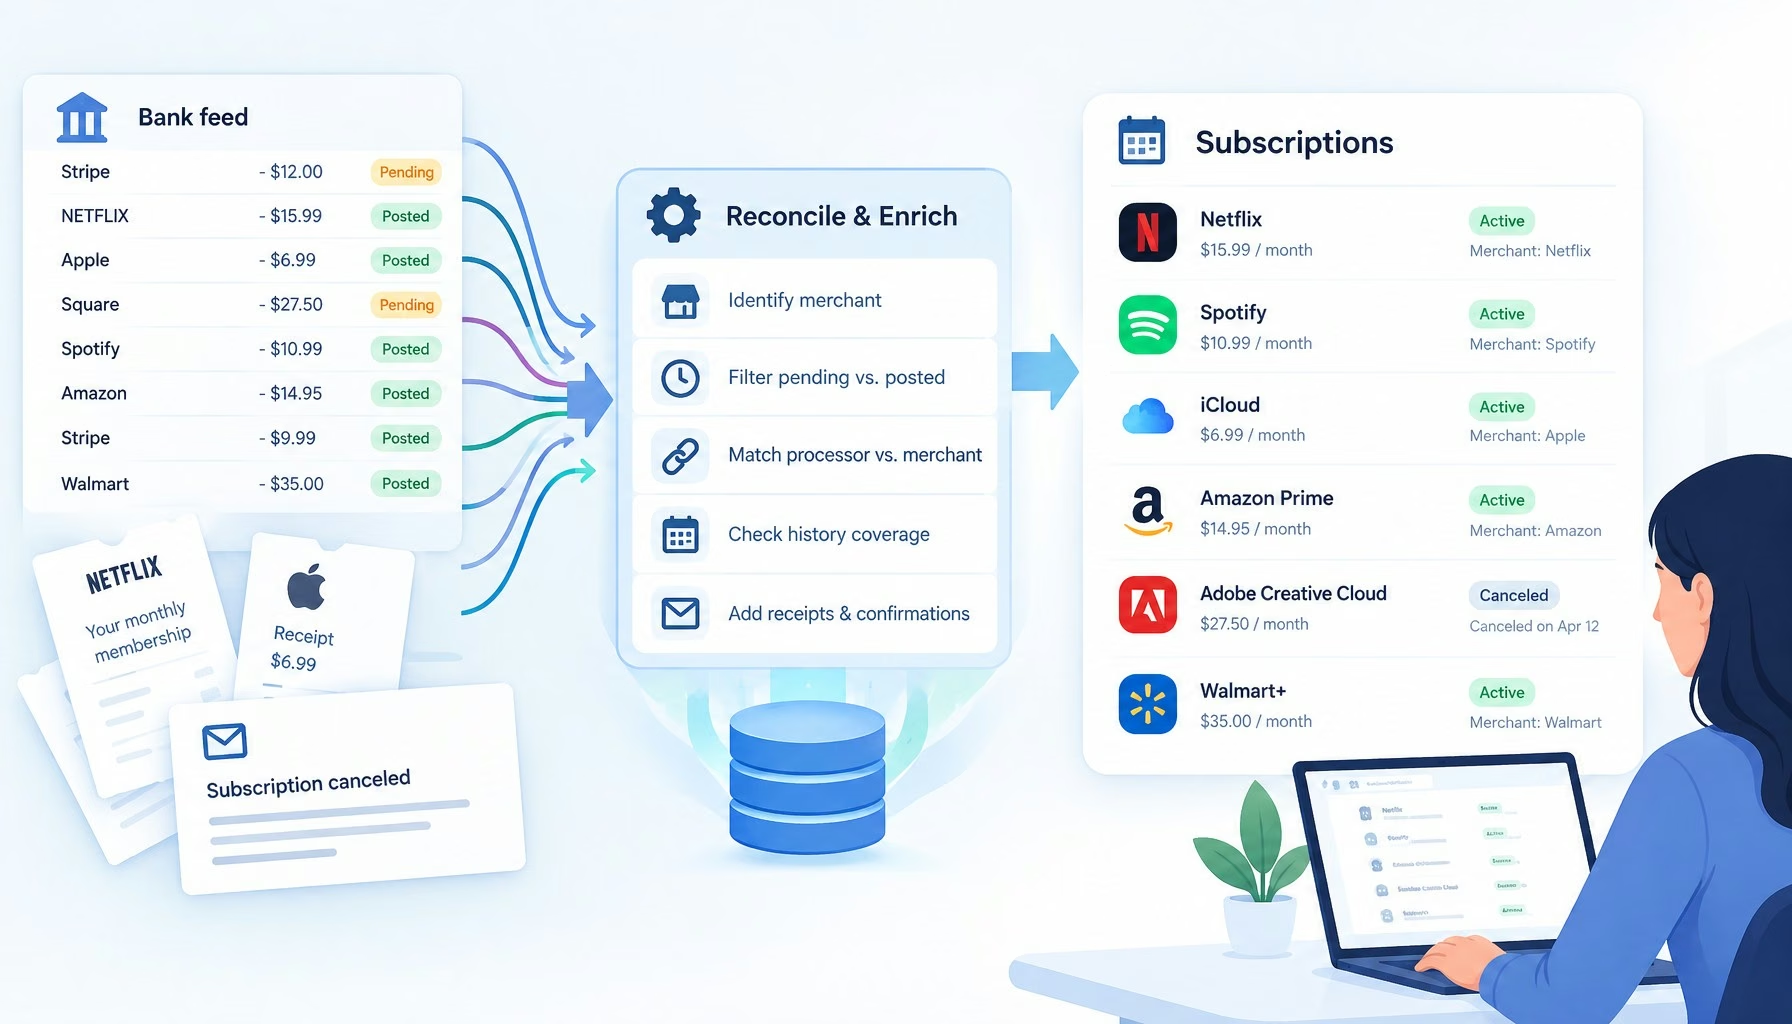
Flat editorial illustration: The article's core relationship is the gap between raw bank-feed records and reliable subscription i
Subscription Trackers Have a Transaction Data Problem
Big Data Exclusive

Stay Connected

1.2KFollowersLike
33.7KFollowersFollow
222FollowersPin

You Might also Like

Machine Learning Provides An Edge With Amazon FBA Product Selection
ExclusiveInfographicMachine Learning

Machine Learning Provides An Edge With Amazon FBA Product Selection

10 Min Read
Is Big Data Modeling Fighting Epidemics of Infectious Diseases?
Big DataExclusiveNews

Is Big Data Modeling Fighting Epidemics of Infectious Diseases?

5 Min Read
7 Ways Smart Data Can Reduce Business Costs
Big DataBusiness IntelligenceInternet of Things

7 Ways Smart Data Can Reduce Business Costs

8 Min Read
How Data Analytics Is Changing The Insurance Industry
AnalyticsBig DataExclusiveWeb Analytics

How Data Analytics Is Changing The Insurance Industry

5 Min Read

SmartData Collective is one of the largest & trusted community covering technical content about Big Data, BI, Cloud, Analytics, Artificial Intelligence, IoT & more.

From Bolts to Bots: How AI Is Fortifying the Automotive Industry
Artificial Intelligence
The Art of Conversation: Enhancing Chatbots with Advanced AI Prompts
Chatbots

Quick Link

  • About
  • Contact
  • Privacy
Follow US
© 2008-26 SmartData Collective. All Rights Reserved.
Welcome Back!

Sign in to your account

Username or Email Address
Password

Lost your password?