

We use cookies, including third-party cookies from Google to serve personalized ads through AdSense, to operate this site and understand how it is used. By continuing to browse, you accept this use. See our Privacy Policy and Terms of Use for details, including how to opt out of personalized advertising.
Accept
SmartData CollectiveSmartData Collective
  • Analytics
    AnalyticsShow More
    What Kind of Problem-Solving Distinguishes Data Analysts From Software Engineers -- AI-generated illustration
    What Kind of Problem-Solving Distinguishes Data Analysts From Software Engineers
    7 Min Read
    chatgpt image jul 21, 2026, 04 34 30 pm
    4 Core Benefits of Predictive Maintenance after Vibration Analysis
    10 Min Read
    How Does Data Mining Boost Customer Satisfaction in Logistics? Harnessing Analytics for Results -- AI-generated illustration
    How Does Data Mining Boost Customer Satisfaction in Logistics? Harnessing Analytics for Results
    11 Min Read
    chatgpt image jul 13, 2026, 04 23 45 pm
    How Data Analytics Helps Companies Improve User Engagement
    19 Min Read
    chatgpt image jul 13, 2026, 03 59 46 pm
    How Data Analytics Improves Multi-Location Search Strategies
    10 Min Read
  • Big Data
  • BI
  • Exclusive
  • IT
  • Marketing
  • Software
Search
© 2008-25 SmartData Collective. All Rights Reserved.
Reading: Board of Directors’ Dashboards – Navigation or naiveté?
Share
Notification
Font ResizerAa
SmartData CollectiveSmartData Collective
Font ResizerAa
Search
  • About
  • Help
  • Privacy
Follow US
© 2008-23 SmartData Collective. All Rights Reserved.
SmartData Collective > Analytics > Board of Directors’ Dashboards – Navigation or naiveté?
AnalyticsBusiness Intelligence

Board of Directors’ Dashboards – Navigation or naiveté?

GaryCokins
GaryCokins
5 Min Read
Board of Directors’ Dashboards – Navigation or naiveté?
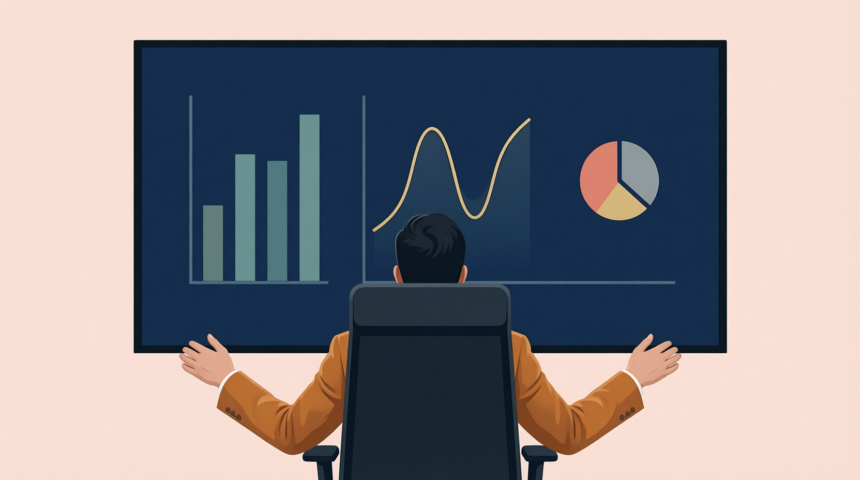
Illustration generated with Qwen Image.
SHARE

Have you ever wondered about how well boards of directors do their job? I have. And I do not have a good answer. But I was stimulated by an article written by Donald Delves, President of The Delves Group, titled “Dashboards for Boards.”

Ever since the Enron meltdown and numerous other companies with governance problems, my perception is that being a board member is no longer a ceremonious job where you simply show up for a board meeting and receive a nice paycheck. I believe that boards are now much more activists in defending the interests of shareholders and investors.

By accepting this perception, I presumed boards have their act fully together. But Delve’s article introduced some doubt with me.

Confusion between scorecards and dashboards

More Read

How Social Intelligence Can Identify Weak Points in Your Customer Journey and Drive Decision-Making
Letter to Operations: no more spreadsheets for Purchasing
What About the Rest of Us?
Utilizing Data to Discover Shortcomings Within Your Business Model
Would Beethoven Have Given a Rat’s Ass about Business Analytics?

Delves’ observation is that younger board members are more shrewd and comfortable with using and deploying information, and they desire access to deeper and more robust information to perform business analytics. However, he states “Truly enlightening dashboards are still a rarity.” To complicate matters, there is confusion about what the difference is between a balanced scorecard and a dashboard. There is similar confusion differentiating key performance indicators (KPIs) from normal and routine measures that we can refer to as just performance indicators (PIs). Both types of measures are important, but they serve different purposes. The adjective “key” of a KPI is the operative term.

When an organization proudly proclaims they have three hundred KPIs, one must ask them the question, “How can they all be a K?” To use a radio analogy, KPIs are what distinguish the signal from the noise – the measures of progress toward strategy execution. As a negative result of this confusion, organizations are including an excessive amount of PIs in their balanced scorecard that should be restricted only to KPIs.

The difference between a scorecard and dashboards comes from the context in how they are applied. Here are some guidelines and definitions for understanding the differences:

  • Scorecards monitor progress toward accomplishing strategic objectives. A scorecard displays periodic snapshots of performance associated with an organization’s strategic objectives and plans. It measures organizational activity at a summary level against pre-defined targets to see if performance is within acceptable ranges and favorable or unfavorable relative to the targets. 
  • Dashboards monitor and measure processes. A dashboard, however, is operational and reports information typically more frequently than scorecards and usually with measures. Each dashboard displays PIs which are reported with little regard to their relationship to other dashboard measures. Dashboard measures do not directly reflect the context of strategic objectives.

In summary, a scorecard serves as a feedback mechanism to allow everyone in the organization, from front-line workers up to the executive team and board directors, to answer the question: “How are we doing on what is important?” More importantly, the scorecard should facilitate analysis to also know why. The idea is not to just monitor the dials but to move the dials.

Board members and business intelligence and analytics

Delves writes this: “Board members do not have to limit themselves to the 30,000 ft. view of the company. Vast amounts of data can be assembled on a regular basis to provide meaningful insight quickly. Given the size and highly complex nature of so many companies, board members have a responsibility to dig deep, be curious, and satisfy that baby boomer urge for the truth.”

But this raises the issue of how easily and flexible is the access to the data and the ability to manipulate it. This is the same conundrum of experienced business analysts. Board members need much more than “drill-down” capabilities. So do managers and employees of the companies that board members provide oversight for.

The problem is many organizations have disparate data sources, “dirty” data quality, and allegedly effective data warehouses. Until these obstacles are fixed, dashboards for boards will remain an elusive goal.
tags: analytics, balanced scorecard, business intelligence, dashboards
TAGGED:analyticsbusiness intelligencedashboards
Share This Article
Facebook Pinterest LinkedIn
Share

Follow us on Facebook

Latest News

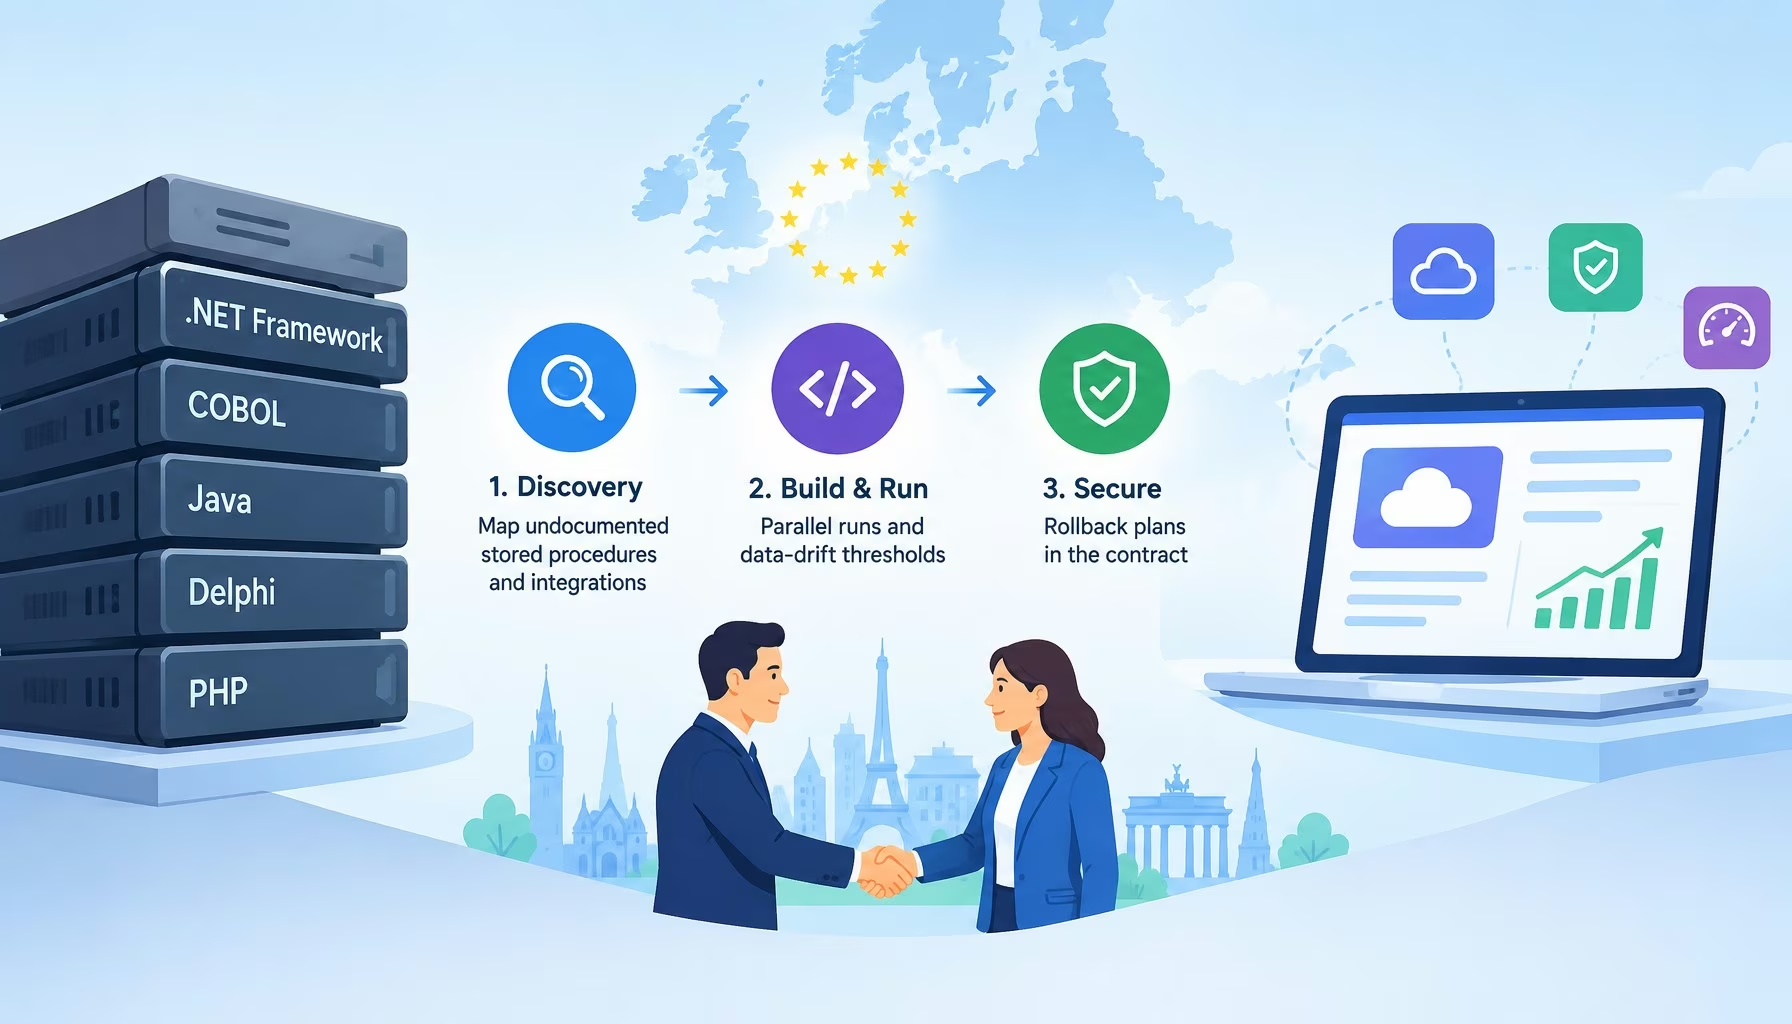
Flat editorial illustration: The article is about modernizing legacy software incrementally without stopping live operations. A t
7 Top Legacy Software Modernization Companies in Europe for 2027
Exclusive Software
Flat editorial illustration: The article weighs control and privacy from self-hosting against analytics depth and the server capa
4 Best Self-Hosted Analytics Solutions
Big Data Business Rules
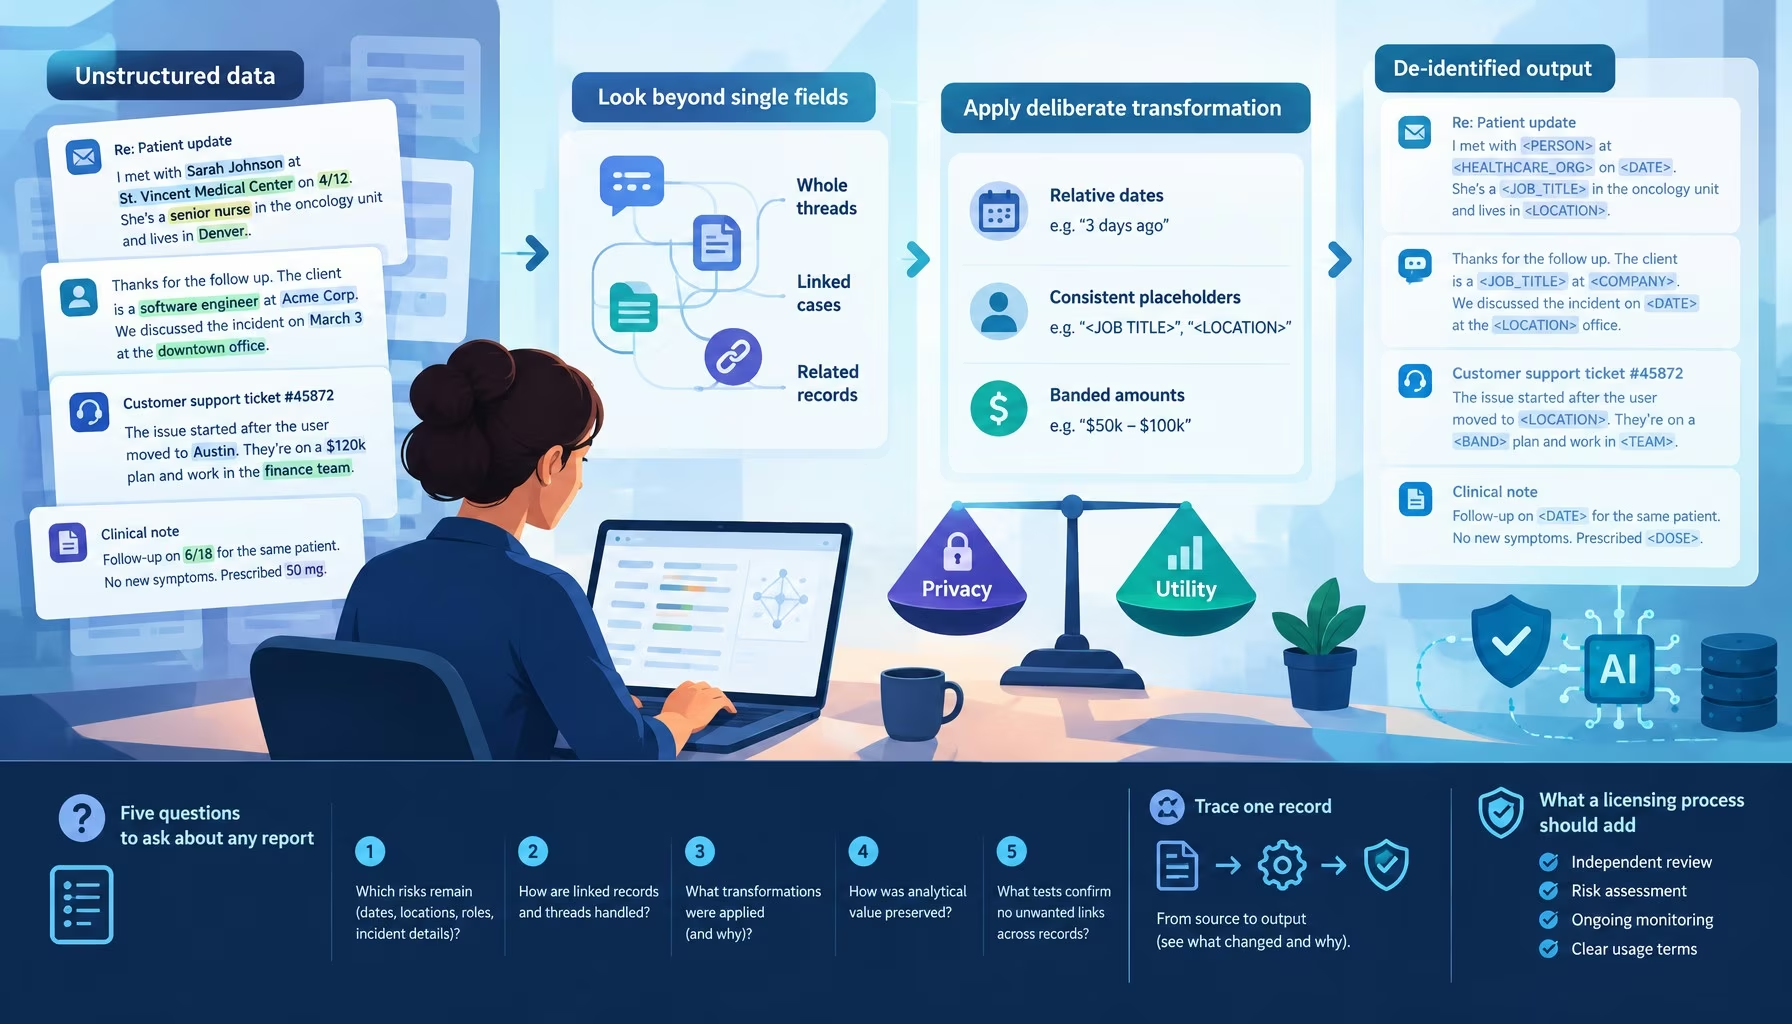
Flat editorial illustration: A tech-editorial depiction of contextual re-identification risk in linked unstructured support recor
Stripping the Names Isn’t Enough: De-Identifying Unstructured Data
Exclusive Unstructured Data
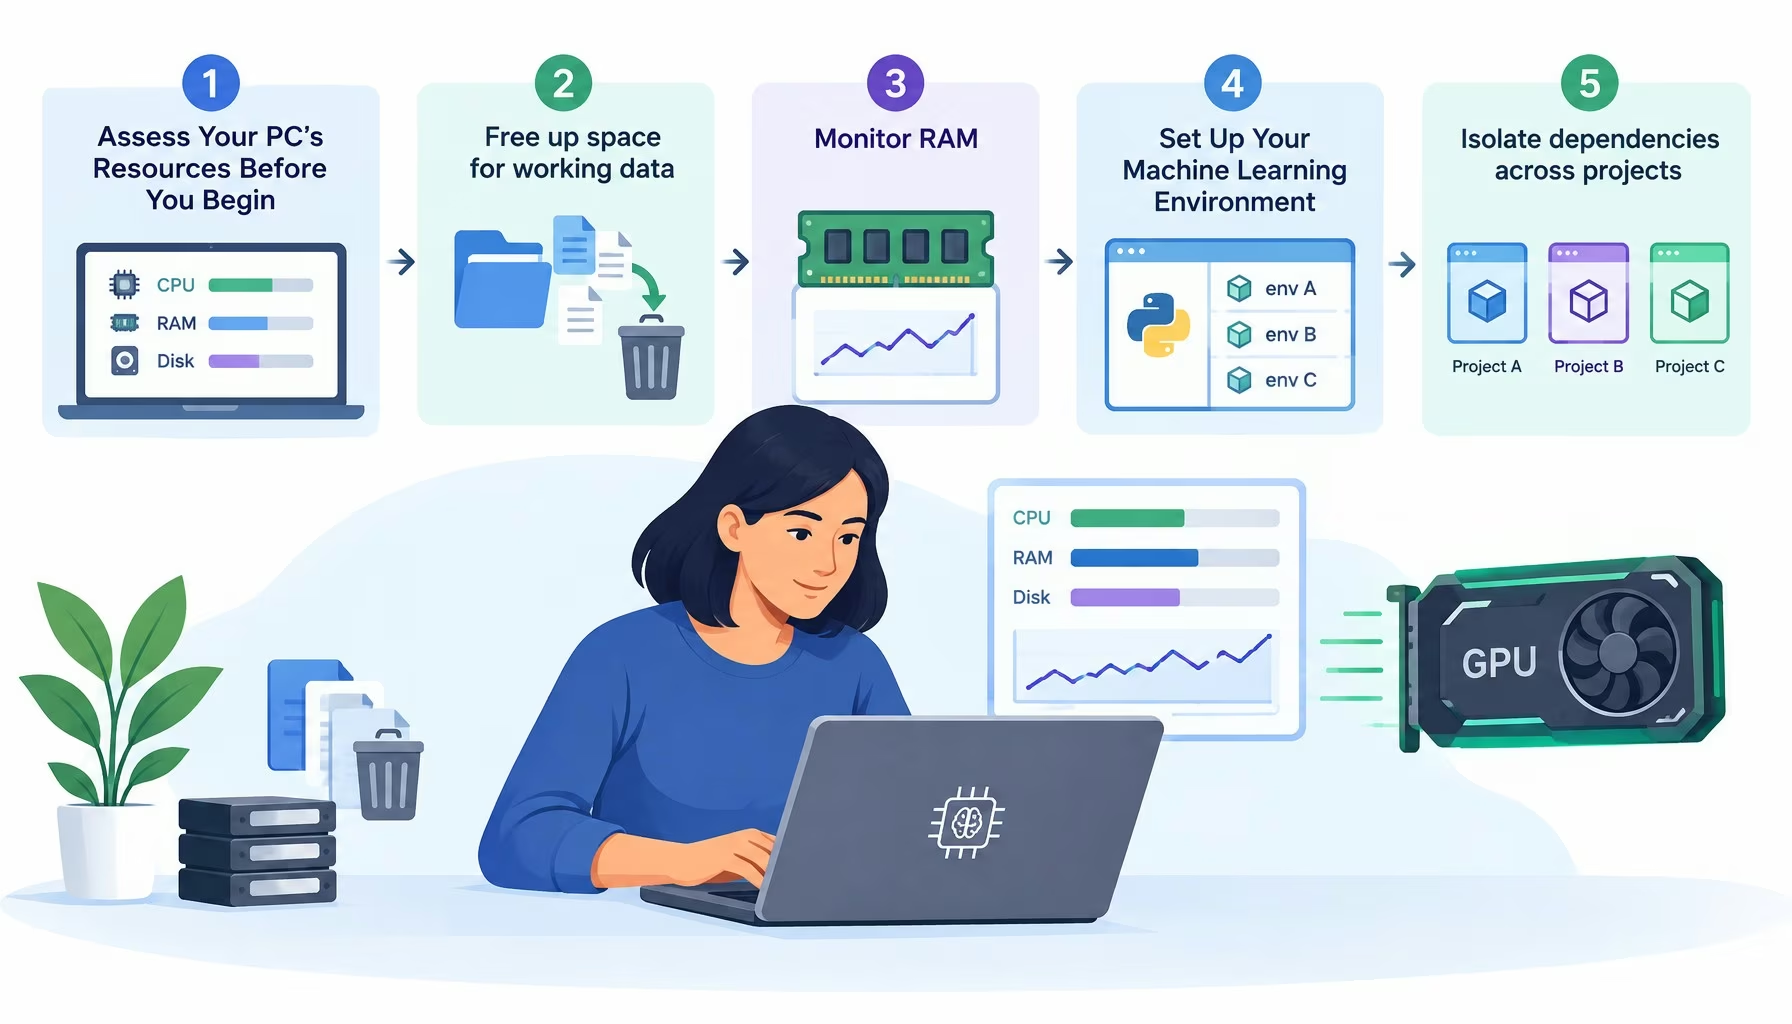
Flat editorial illustration: The article connects practical management of local data, memory and software environments with direc
How Data Professionals Optimize Devices for AI and ML Projects
Artificial Intelligence Data Science Exclusive Machine Learning

Stay Connected

1.2KFollowersLike
33.7KFollowersFollow
222FollowersPin

You Might also Like

New Companies Making Their Fortunes Powered By Analytics And Business Intelligence
Business Intelligence

New Companies Making Their Fortunes Powered By Analytics And Business Intelligence

3 Min Read
The ‘Big Data’ Buzz – Revolution or Evolution?
AnalyticsBest PracticesBusiness IntelligenceCloud ComputingData MiningExclusive

The ‘Big Data’ Buzz – Revolution or Evolution?

6 Min Read
Dashboards should do more than raise your blood pressure
Business IntelligenceData MiningData Visualization

Dashboards should do more than raise your blood pressure

5 Min Read
The Role of Data Analytics in Football Performance
AnalyticsBig DataExclusive

The Role of Data Analytics in Football Performance

9 Min Read

SmartData Collective is one of the largest & trusted community covering technical content about Big Data, BI, Cloud, Analytics, Artificial Intelligence, IoT & more.

ai chatbot
How AI Website Chatbots Improve Customer Support and Lead Generation
Chatbots Exclusive
Chatbots and SEO: How Can Chatbots Improve Your SEO Ranking?
Artificial Intelligence Chatbots Exclusive

Quick Link

  • About
  • Contact
  • Privacy
Follow US
© 2008-26 SmartData Collective. All Rights Reserved.
Welcome Back!

Sign in to your account

Username or Email Address
Password

Lost your password?