We use cookies, including third-party cookies from Google to serve personalized ads through AdSense, to operate this site and understand how it is used. By continuing to browse, you accept this use. See our Privacy Policy and Terms of Use for details, including how to opt out of personalized advertising.
Accept
SmartData CollectiveSmartData Collective
  • Analytics
    AnalyticsShow More
    Flat editorial illustration: The article is about joining public web signals with internal business metrics so BI teams can inter
    Alternative Data in BI: Bringing Public Web Data Into Your Dashboards
    23 Min Read
    Flat editorial illustration: The article contrasts passive follower totals with a behavioral path from attention and trust to cli
    Creator Analytics Beyond Follower Count: Seven Metrics That Measure Audience Behavior
    11 Min Read
    Flat editorial illustration: The article connects AI and marketing analytics with managerial judgment grounded in consumer behavi
    How an Online MBA in Marketing Connects AI and Data Analytics
    11 Min Read
    What Kind of Problem-Solving Distinguishes Data Analysts From Software Engineers -- AI-generated illustration
    What Kind of Problem-Solving Distinguishes Data Analysts From Software Engineers
    7 Min Read
    chatgpt image jul 21, 2026, 04 34 30 pm
    4 Core Benefits of Predictive Maintenance after Vibration Analysis
    10 Min Read
  • Big Data
  • BI
  • Exclusive
  • IT
  • Marketing
  • Software
Search
© 2008-25 SmartData Collective. All Rights Reserved.
Reading: Data Visualizations: The Tip of the Iceberg of Understanding

Share
Notification
Font ResizerAa
SmartData CollectiveSmartData Collective
Font ResizerAa
Search
  • About
  • Help
  • Privacy
Follow US
© 2008-23 SmartData Collective. All Rights Reserved.
SmartData Collective > Uncategorized > Data Visualizations: The Tip of the Iceberg of Understanding
Uncategorized

Data Visualizations: The Tip of the Iceberg of Understanding

Erica Driver
Erica Driver
0 Min Read
Data Visualizations: The Tip of the Iceberg of Understanding

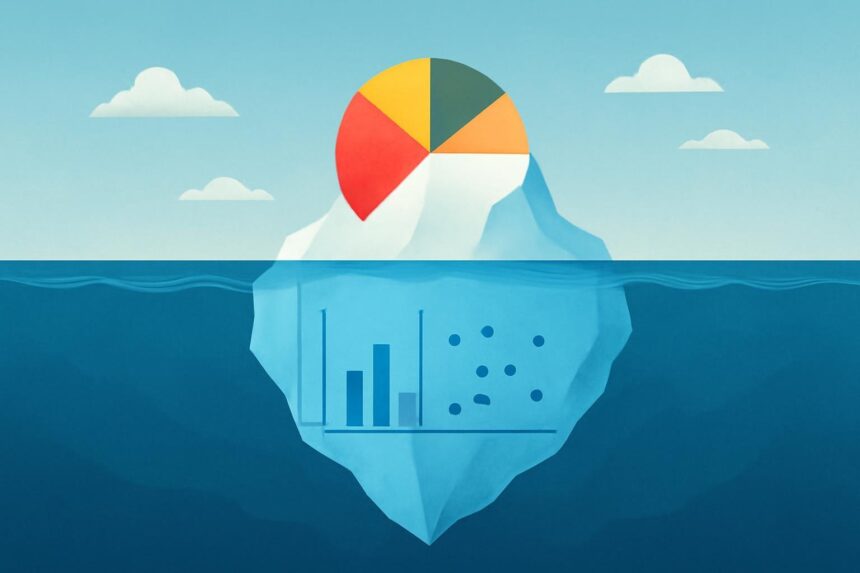
Illustrative image generated with OpenAI gpt-image-1.
SHARE

Thanks to Tom Mackay, principal solution architect at QlikTech, I recently came upon the article “Seven Dirty Secrets of Data Visualisation,” by programmer Nate Agrin and data visualization developer

Thanks to Tom Mackay, principal solution architect at QlikTech, I recently came upon the article “Seven Dirty Secrets of Data Visualisation,” by programmer Nate Agrin and data visualization developer Nick Rabinowitz. In addition to shining light on some best practices in data visualization, this article helps illuminate the difference between standalone data visualization tools and a Business Discovery platform.

The article covered seven dirty secrets of web-based data visualizations; I have thoughts about a few of them:

  • Secret #1: Real data is ugly. The article points out that before data can be accessible to, and useful with, data visualization software, a data expert has to find, acquire, load, clean, and transform it. This problem is compounded when the data comes from multiple sources. A lesson? Look for Business Discovery software that enables you to begin working with and analyzing even imperfect data without requiring a whole boat load of external (ETL extract, transform, load) capabilities. Discovery begins with the data. Being able to immediately see the mis-typed, out-of-range, or missing lets you begin tackling the problem from the start.
  • Secret #3: There’s no substitute for real data. When getting your hands on software to help you make sense of your data, try it out with your own real data – not dummy sample data. It’s in quickly and easily being able to see the associations in your own real data that the “a-ha” moments occur. This experience may be especially powerful with data sourced from disparate systems. “There is nothing like the moment when a user sees associations between data they have never been able to bring together before,” says Tom Mackay, principal solution architect at QlikTech. He’s speaking from experience; he’s seen it happen time and again at customer sites.
  • Secret #6: Visualization is not analysis. Agrin and Rabinowiz argued that visualization is a tool to aid analysis, not a substitute for analytical or statistics skill. True. But it’s not either/or; an analytic app can contain both detailed data, with complex statistical expressions applied, and visualizations that help simplify the picture. Users can analyze the data in the way that is most comfortable for them. And: clear, well-labeled, interactive charts and graphs that are part of an analytic app make it easy for even non-data analysts to explore information and derive insights and meaning – critical in a world where information is strategic and we all have to know how to work with it.
  • Secret #2: A bar chart is usually better. “The coolest-looking visualisations are often the least useful,” the authors wrote. They pointed out that the cost of the novelty and visual appeal of some data visualizations is clarity of meaning. This potentially leads to comparisons that distort the data and takes viewers to false conclusions. The authors made the same point about animations (“secret #5: animate only when appropriate”) and recommended making animations simple, predictable, and replayable. I’d add that another complicating factor is the variety of devices people are using to interact with analytic apps, including tablets and smartphones. We offer some design suggestions of our own in this Technical Brief: “Mobile User Interface Design Best Practices.”
  • Secret #7: Data visualization takes more than code. “. . . Creating visualisations that offer real insight or tell a compelling story still requires a particularly wide range of real skills in addition to coding, including graphic design, data analysis, and an understanding of interaction design and human perception,” the authors wrote. A complicating factor is that data experts tend not to be graphic designers. To get past this dichotomy, check out the tips our experts offer on the QlikView Design Blog and take a look at how we are focused on closing the gap between data and design with the next generation of QlikView.

Visualizations are just the tip of the iceberg, if the iceberg is a person’s understanding of the data. To be able to derive meaning and insight from data, especially complex data sourced from multiple systems, the user requires not only well-designed, clear, concise data visualizations, but the ability to explore the full dataset on their own. They need to be able to ask and answer their own streams of questions without having to go back to an expert for a new visualization every time they have a follow-up question. This, in a nutshell, is the difference between a standalone data visualization tool and a Business Discovery platform.

TAGGED:analyticsbest practicesbig databusiness intelligencechartdata visualizationgraphstatistics
Share This Article
Facebook Pinterest LinkedIn
Share

Follow us on Facebook

Latest News

Flat editorial illustration: The article is about joining public web signals with internal business metrics so BI teams can inter
Alternative Data in BI: Bringing Public Web Data Into Your Dashboards
Big Data Business Intelligence Exclusive Web Analytics
Flat editorial illustration: A SaaS-editorial scene showing product usage, support patterns, and renewal feedback informing a fle
Using Product Usage Analytics and Support Data to Build a B2B Product Roadmap
Business Intelligence Infographic
From Hiring To Payroll: Managing HR Data Across Business Systems -- AI-generated illustration
From Hiring To Payroll: Managing HR Data Across Business Systems
Big Data Business Intelligence Infographic
Flat editorial illustration: The article is about automating the collection, preparation, and delivery of marketing data across p
From Data to Dashboards: 5 Marketing Reporting Automation Software Picks
Big Data Business Intelligence Exclusive

Stay Connected

1.2KFollowersLike
33.7KFollowersFollow
222FollowersPin

You Might also Like

Big Data Creates Numerous New Perks in the Gig Economy
Big Data

Big Data Creates Numerous New Perks in the Gig Economy

7 Min Read
GPS location data
Big DataExclusive

New Report Shows Big Data Plays Key Role In Improving Driver Safety

5 Min Read
Data Analytics Optimizes Shipping through KPI Tracking
AnalyticsBig DataExclusive

Data Analytics Optimizes Shipping through KPI Tracking

7 Min Read
Innovative Brands Use Big Data to Improve Sticker Branding
Big DataExclusiveMarketing

Innovative Brands Use Big Data to Improve Sticker Branding

6 Min Read

SmartData Collective is one of the largest & trusted community covering technical content about Big Data, BI, Cloud, Analytics, Artificial Intelligence, IoT & more.

From Bolts to Bots: How AI Is Fortifying the Automotive Industry
Artificial Intelligence
ai chatbot
How AI Website Chatbots Improve Customer Support and Lead Generation
Chatbots Exclusive

Quick Link

  • About
  • Contact
  • Privacy
Follow US
© 2008-26 SmartData Collective. All Rights Reserved.
Welcome Back!

Sign in to your account

Username or Email Address
Password

Lost your password?