
We use cookies, including third-party cookies from Google to serve personalized ads through AdSense, to operate this site and understand how it is used. By continuing to browse, you accept this use. See our Privacy Policy and Terms of Use for details, including how to opt out of personalized advertising.
Accept
SmartData CollectiveSmartData Collective
  • Analytics
    AnalyticsShow More
    What Kind of Problem-Solving Distinguishes Data Analysts From Software Engineers -- AI-generated illustration
    What Kind of Problem-Solving Distinguishes Data Analysts From Software Engineers
    7 Min Read
    chatgpt image jul 21, 2026, 04 34 30 pm
    4 Core Benefits of Predictive Maintenance after Vibration Analysis
    10 Min Read
    How Does Data Mining Boost Customer Satisfaction in Logistics? Harnessing Analytics for Results -- AI-generated illustration
    How Does Data Mining Boost Customer Satisfaction in Logistics? Harnessing Analytics for Results
    11 Min Read
    chatgpt image jul 13, 2026, 04 23 45 pm
    How Data Analytics Helps Companies Improve User Engagement
    19 Min Read
    chatgpt image jul 13, 2026, 03 59 46 pm
    How Data Analytics Improves Multi-Location Search Strategies
    10 Min Read
  • Big Data
  • BI
  • Exclusive
  • IT
  • Marketing
  • Software
Search
© 2008-25 SmartData Collective. All Rights Reserved.
Reading: Data Visualization Doesn’t Need to be Biased
Share
Notification
Font ResizerAa
SmartData CollectiveSmartData Collective
Font ResizerAa
Search
  • About
  • Help
  • Privacy
Follow US
© 2008-23 SmartData Collective. All Rights Reserved.
SmartData Collective > R Programming Language > Data Visualization Doesn’t Need to be Biased
R Programming Language

Data Visualization Doesn’t Need to be Biased

DavidMSmith
DavidMSmith
4 Min Read
Data Visualization Doesn't Need to be Biased
Photo by VentaRisk on Pixabay (https://pixabay.com/photos/arabic-script-writing-language-iraq-1174145/)
SHARE

At the FlowingData blog, data visualization commentator and Visualize This author Nathan Yau lists 5 misconceptions about visualization:

  • Software does everything (Nathan notes “Personally, I use a lot of R and have a lot of fun in Illustrator”, but uses a lot of other tools as well.)
  • Visualization is for making data flashy
  • The more information in a single graphic, the better
  • It has to be exact
  • Visualization is too biased to be useful

I agree completely with Nathan’s comments on the last point above:

There’s a certain amount of subjectivity that goes into any visualization as you choose what data to show and how to show it. By focusing on one part of the data, you might inadvertently obscure another. However, if you’re careful, get to know the data that you’re dealing with, and stay true to what’s there, then it should be easier to overcome bias.

After all, statistics is somewhat subjective, too. You choose what you analyze, what methods to use, and pick what to point out in reports.

News organizations, for example, have to do this all the time. They get a dataset, decide what story they want to tell (or find what story the data has to tell). Browse through graphics by The New York Times, and you can see how you can add a layer of information that objectively describes what the data is about.

This stands in contrast to the presentation I saw today at the Strata conference from Alex Lundry, Chart Wars: The Political Power of Data Visualization. (You can see a shorter version of his talk online). It was an entertaining talk, but his main point was to encourage data visualization partitioners to actively insert a point of view into the presentation of data. For example, he encourages more charts like the one on the right below, rather than the one on the left.

(Images from Nigel Holmes’ paper, Useful Junk? The Effects of Visual Embellishment on Comprehension and Memorability of Charts.)

More Read

Yes, you need more than just R for Big Data Analytics.
Choosing the Right Programming Language for A Corporate Database
3 Hours of Pure Soccer Emotion, Visualized with R
Data Science Education Gets Personal
Benchmarking bigglm

Lundry’s take is that because the image on the right is more easily recalled by those who have seen it, it’s naturally better. I disagree. My objection to the chart on the right isn’t just that uses chartjunk, nor that the teeth are disporoportionately sized to the values, nor even that the X “axis” is slanted upwards to exaggerate the rise. My objection is the chart on the right is that it actively pushes an analysis upon the viewer. As Nathan notes, there’s always an element of bias in what data is selected to be presented, and the way it’s presented. But good charts merely present data, and leave the analysis (obvious though it may be) to the viewer. When a chart takes on the burden of analysis for the viewer, that’s when it strays from data visualization into propaganda.

FlowingData: 5 misconceptions about visualization 

Share This Article
Facebook Pinterest LinkedIn
Share

Follow us on Facebook

Latest News

Flat editorial illustration: The article's core relationship is workload-by-workload decision-making for cloud migration, where s
Which Workloads Should Move to the Cloud?
Cloud Computing Exclusive IT
Flat editorial illustration: The article positions data governance as a strategic board-level concern rather than a purely techni
Why Data Governance Is Becoming a Board-Level Business Priority
Big Data Exclusive Policy and Governance
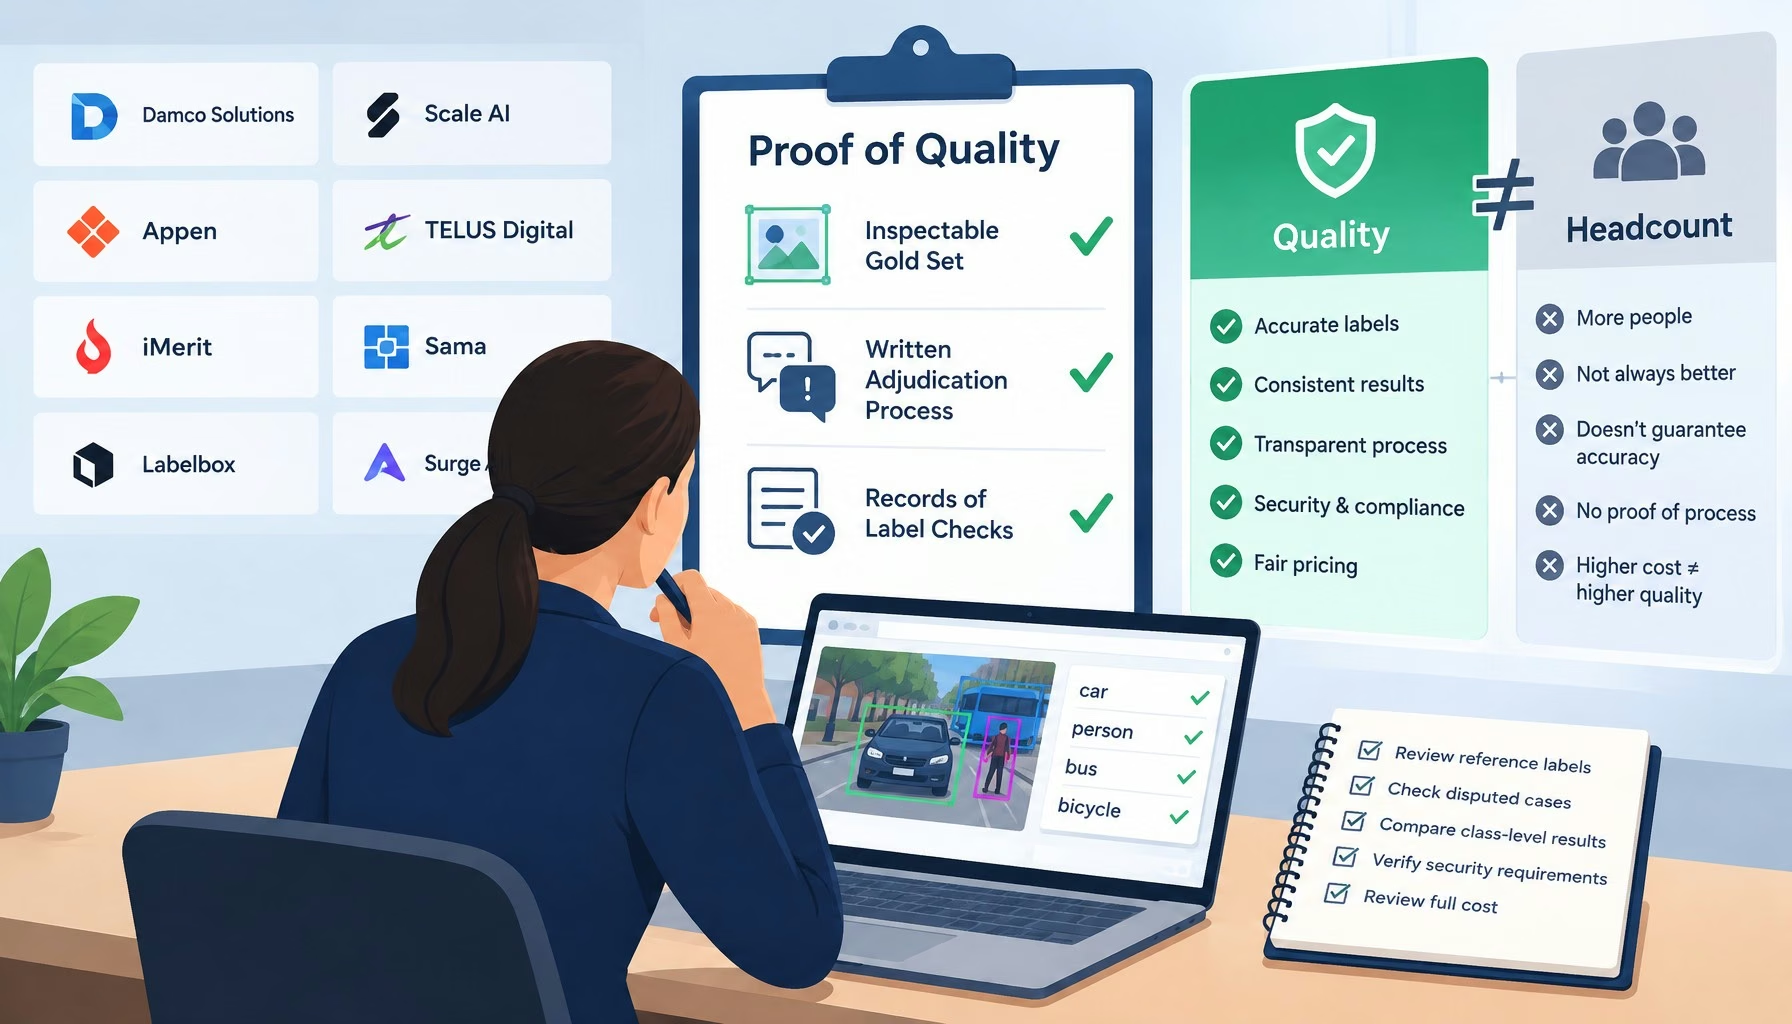
Flat editorial illustration: The article argues that data annotation quality should be measured by inspectable gold sets, written
The Top Data Annotation Companies Are Separated by Proof of Quality, Not Headcount
Big Data Exclusive
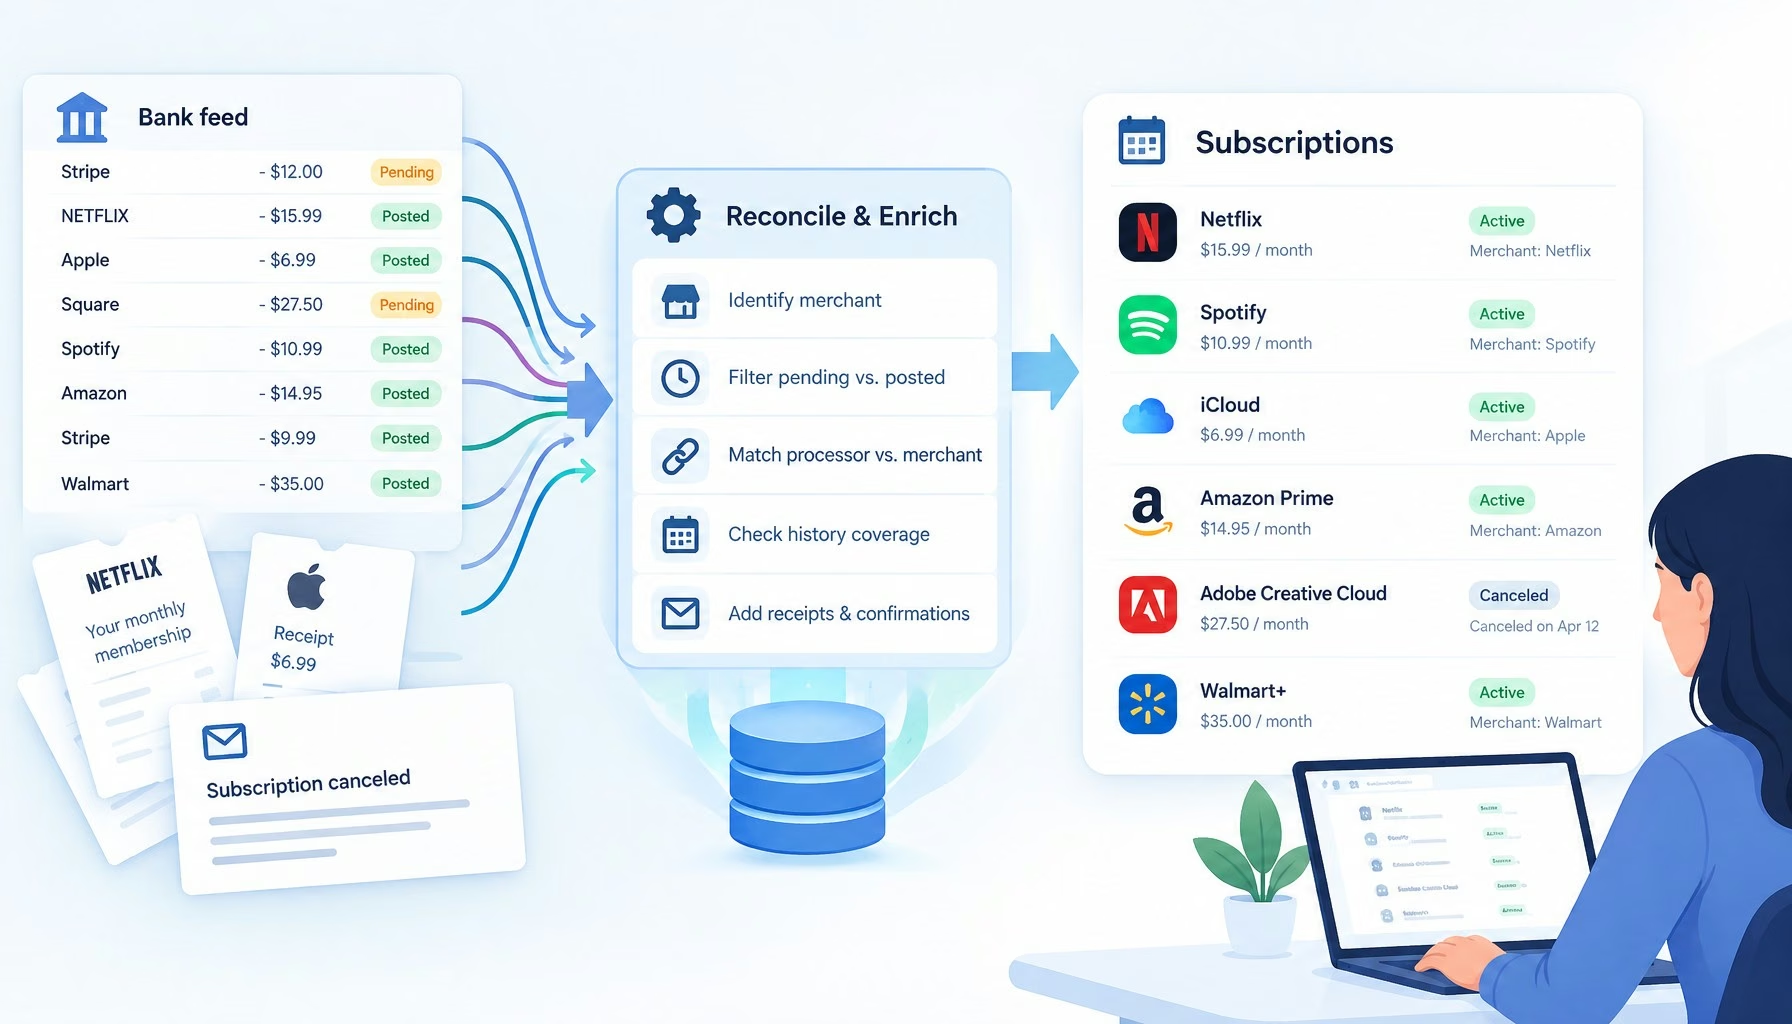
Flat editorial illustration: The article's core relationship is the gap between raw bank-feed records and reliable subscription i
Subscription Trackers Have a Transaction Data Problem
Big Data Exclusive

Stay Connected

1.2KFollowersLike
33.7KFollowersFollow
222FollowersPin

You Might also Like

Vector Computing, Who Is More Powerful, R Language or esProc?
R Programming Language

Vector Computing, Who Is More Powerful, R Language or esProc?

6 Min Read
The Role of Standards in Predictive Analytics: A Series
AnalyticsHadoopPredictive AnalyticsR Programming Language

The Role of Standards in Predictive Analytics: A Series

3 Min Read
Applications of R at Google
R Programming Language

Applications of R at Google

3 Min Read
An Analysis of the R-help Mailing List
AnalyticsR Programming Language

An Analysis of the R-help Mailing List

3 Min Read

SmartData Collective is one of the largest & trusted community covering technical content about Big Data, BI, Cloud, Analytics, Artificial Intelligence, IoT & more.

Chatbots and SEO: How Can Chatbots Improve Your SEO Ranking?
Artificial Intelligence Chatbots Exclusive
AI chatbots
AI Chatbots Can Help Retailers Convert Live Broadcast Viewers into Sales!
Chatbots

Quick Link

  • About
  • Contact
  • Privacy
Follow US
© 2008-26 SmartData Collective. All Rights Reserved.
Welcome Back!

Sign in to your account

Username or Email Address
Password

Lost your password?