We use cookies, including third-party cookies from Google to serve personalized ads through AdSense, to operate this site and understand how it is used. By continuing to browse, you accept this use. See our Privacy Policy and Terms of Use for details, including how to opt out of personalized advertising.
Accept
SmartData CollectiveSmartData Collective
  • Analytics
    AnalyticsShow More
    Flat editorial illustration: The article connects AI and marketing analytics with managerial judgment grounded in consumer behavi
    How an Online MBA in Marketing Connects AI and Data Analytics
    11 Min Read
    What Kind of Problem-Solving Distinguishes Data Analysts From Software Engineers -- AI-generated illustration
    What Kind of Problem-Solving Distinguishes Data Analysts From Software Engineers
    7 Min Read
    chatgpt image jul 21, 2026, 04 34 30 pm
    4 Core Benefits of Predictive Maintenance after Vibration Analysis
    10 Min Read
    How Does Data Mining Boost Customer Satisfaction in Logistics? Harnessing Analytics for Results -- AI-generated illustration
    How Does Data Mining Boost Customer Satisfaction in Logistics? Harnessing Analytics for Results
    11 Min Read
    chatgpt image jul 13, 2026, 04 23 45 pm
    How Data Analytics Helps Companies Improve User Engagement
    19 Min Read
  • Big Data
  • BI
  • Exclusive
  • IT
  • Marketing
  • Software
Search
© 2008-25 SmartData Collective. All Rights Reserved.
Reading: For Data Visualization, Circles Don’t Cut It
Share
Notification
Font ResizerAa
SmartData CollectiveSmartData Collective
Font ResizerAa
Search
  • About
  • Help
  • Privacy
Follow US
© 2008-23 SmartData Collective. All Rights Reserved.
SmartData Collective > Big Data > Data Visualization > For Data Visualization, Circles Don’t Cut It
Data Visualization

For Data Visualization, Circles Don’t Cut It

DavidMSmith
DavidMSmith
3 Min Read
For Data Visualization, Circles Don't Cut It
Photo by Vito Goričan on Pexels (https://www.pexels.com/photo/close-up-shot-of-a-computer-screen-6253568/)
SHARE

During President Obama’s State of the Union speech on Tuesday night, the live feed at the White House website featured PowerPoint-style infographics and bullet points to accompany the President’s statements. One of those charts was a comparison of the GDP of the United States and its nearest rivals:

Sotu-circles

Notice anything odd? The 2010 GDP of the US isn’t quite three times that of China, but you could easily fit four of those China circles in the US one, if not more. In fact, the area of those circles are proportional to the square of GDP, as Dan Meyer illustrates with amusing snark. Scaling a variable to one dimension (here, diameter) of a two-dimensional shape is a rookie mistake in data visualization, an issue Edward Tufte popularized in his book The Visual Display of Quantitative Information. And given that Tufte was recruited by the White House to improve communication about data that chart is, well, a bit embarrassing.

But even when the area of is appropriately scaled, circles are still a poor tool for communicating information about numbers. Pie charts are circles, and it’s well known that pie charts suck when it comes to comparing proportions. And even simple circles are hard to compare, as amply demonstrated in this demonstration from the blog Contrast:

More Read

How Data Analytics Helps Sports Teams Win
Tableau Thrives in Providing Visual Discovery for Business Analytics
How to Segment Your Customer Database (Frequent Flyer Edition)
Mobile Advertising, Clustering Algorithms, and Your Ticket for a Free Ride
Great Examples of US Government BI Transparency

Circles are bad

“If you could have the profits of company A, or those of B,C,D,and E combined, which would you take?”

The answer is that the area of A is greater than that of B, C, D and E together, but that’s hardly apparent to my eye. The whole post is well worth a read — it’s chock filled with examples of good and ba data visualizations — and a fine testament to the principles of Tufte.

Constrast: Infographics and Data Visualisations (via)
Share This Article
Facebook Pinterest LinkedIn
Share

Follow us on Facebook

Latest News

Flat editorial illustration: The article links specialist ecommerce SEO agency evaluation to joined-up organic and paid search da
Choosing an Ecommerce SEO Agency When Search Data Drives the Decision
Big Data Exclusive
Flat editorial illustration: The article’s core relationship is that restoring a refrigeration system does not establish trustwor
After the Cyberattack, Can You Trust the Machine?
Artificial Intelligence News
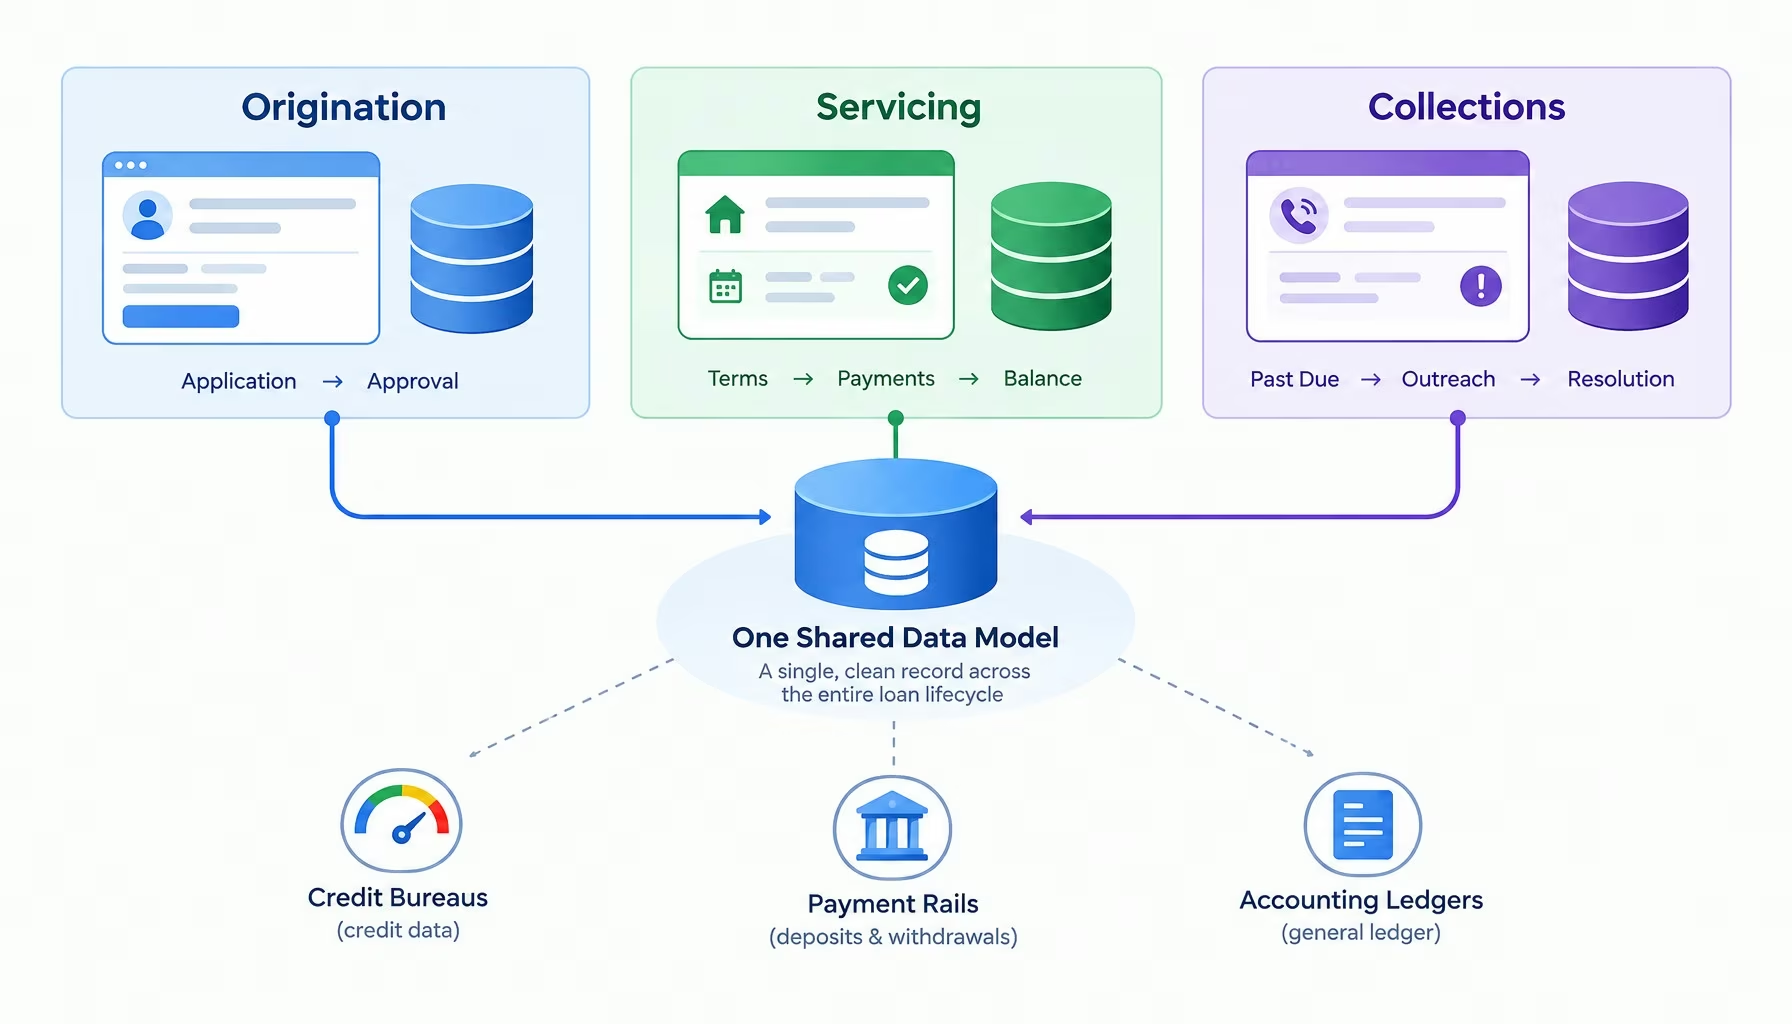
Flat editorial illustration: A technology-editorial comparison of disconnected origination, servicing, and collections records dr
The Data Reconciliation Problem Inside Disconnected Lending Systems
Big Data Exclusive Fintech
Flat editorial illustration: The article connects AI and marketing analytics with managerial judgment grounded in consumer behavi
How an Online MBA in Marketing Connects AI and Data Analytics
Analytics Artificial Intelligence Big Data Exclusive

Stay Connected

1.2KFollowersLike
33.7KFollowersFollow
222FollowersPin

You Might also Like

We Need an "Internet of Not Only Customers"
AnalyticsBest PracticesBig DataBusiness IntelligenceCloud ComputingCRMData ManagementData MiningData QualityData VisualizationData WarehousingMarketingModelingSoftwareSQL

We Need an “Internet of Not Only Customers”

15 Min Read
Start Up Spotlight: UserVoice
Business IntelligenceData Visualization

Start Up Spotlight: UserVoice

5 Min Read
Cloud
AnalyticsBest PracticesBusiness IntelligenceCloud ComputingData VisualizationDecision ManagementPredictive AnalyticsWeb Analytics

4 Questions to Ask Before You Define Your Cloud BI Strategy

5 Min Read
Visualize Your Data
Data Visualization

Visualize Your Data

5 Min Read

SmartData Collective is one of the largest & trusted community covering technical content about Big Data, BI, Cloud, Analytics, Artificial Intelligence, IoT & more.

ai chatbot
How AI Website Chatbots Improve Customer Support and Lead Generation
Chatbots Exclusive
Chatbots and SEO: How Can Chatbots Improve Your SEO Ranking?
Artificial Intelligence Chatbots Exclusive

Quick Link

  • About
  • Contact
  • Privacy
Follow US
© 2008-26 SmartData Collective. All Rights Reserved.
Welcome Back!

Sign in to your account

Username or Email Address
Password

Lost your password?