We use cookies, including third-party cookies from Google to serve personalized ads through AdSense, to operate this site and understand how it is used. By continuing to browse, you accept this use. See our Privacy Policy and Terms of Use for details, including how to opt out of personalized advertising.
Accept
SmartData CollectiveSmartData Collective
  • Analytics
    AnalyticsShow More
    What Kind of Problem-Solving Distinguishes Data Analysts From Software Engineers -- AI-generated illustration
    What Kind of Problem-Solving Distinguishes Data Analysts From Software Engineers
    7 Min Read
    chatgpt image jul 21, 2026, 04 34 30 pm
    4 Core Benefits of Predictive Maintenance after Vibration Analysis
    10 Min Read
    How Does Data Mining Boost Customer Satisfaction in Logistics? Harnessing Analytics for Results -- AI-generated illustration
    How Does Data Mining Boost Customer Satisfaction in Logistics? Harnessing Analytics for Results
    11 Min Read
    chatgpt image jul 13, 2026, 04 23 45 pm
    How Data Analytics Helps Companies Improve User Engagement
    19 Min Read
    chatgpt image jul 13, 2026, 03 59 46 pm
    How Data Analytics Improves Multi-Location Search Strategies
    10 Min Read
  • Big Data
  • BI
  • Exclusive
  • IT
  • Marketing
  • Software
Search
© 2008-25 SmartData Collective. All Rights Reserved.
Reading: A Great Example of Simpson’s Paradox: US Median Wage Decline
Share
Notification
Font ResizerAa
SmartData CollectiveSmartData Collective
Font ResizerAa
Search
  • About
  • Help
  • Privacy
Follow US
© 2008-23 SmartData Collective. All Rights Reserved.
SmartData Collective > Big Data > Workforce Data > A Great Example of Simpson’s Paradox: US Median Wage Decline
Big DataWorkforce Data

A Great Example of Simpson’s Paradox: US Median Wage Decline

DavidMSmith
DavidMSmith
2 Min Read
A Great Example of Simpson's Paradox: US Median Wage Decline
Illustration generated with Qwen Image.
SHARE

Since 2000, the median US wage has risen about 1%, adjusted for inflation.

But over the same period, the median wage for:

Since 2000, the median US wage has risen about 1%, adjusted for inflation.

But over the same period, the median wage for:

More Read

The Importance of Data Protection During the Coronavirus Pandemic
Driving Adoption of Social Collaboration Tools
Why the Integrated Approach to Mobile Devices is Winning
Population health management with RevoScaleR
Workforce Planning and HR Analytics
  • high school dropouts,
  • high school graduates with no college education,
  • people with some college education, and
  • people with Bachelor’s or higher degrees

have all decreased. In other words, within every educational subgroup, the median wage is lower now than it was in 2000.

How can both things be true: overall wages have risen, but wages within every subgroup have fallen? This is a great example of Simpson’s Paradox. In this particular case, the explanation lies in the changing educational profile of the workforce over the past 13 years: there are now many more college graduates (who get higher-paying jobs) than there were in 2000, but wages for college graduates collectively have fallen at a much slower rate (down 1.2%) than for those of lower educational attainment (whose wages have fallen precipitously, down 7.9% for high school dropouts). The growth in the proportion of college graduates swamps the wage decline for specific groups.

Simpson’s Paradox isn’t really a paradox at all, it just reflects the fact that your perception of events can change depending on your viewpoint. From the points of view of an economist looking at the national economy, the “headline” rate of overall median wages has slightly increased, largely due to changes in demographics. But from the point of view of a typical individual, wages have declined. The New Statesman says that “it’s more accurate to say that wages have fallen in the last thirty years even though the headline figure shows otherwise”, but it all depends on your perspective.

image: workforce/shutterstock
Share This Article
Facebook Pinterest LinkedIn
Share

Follow us on Facebook

Latest News

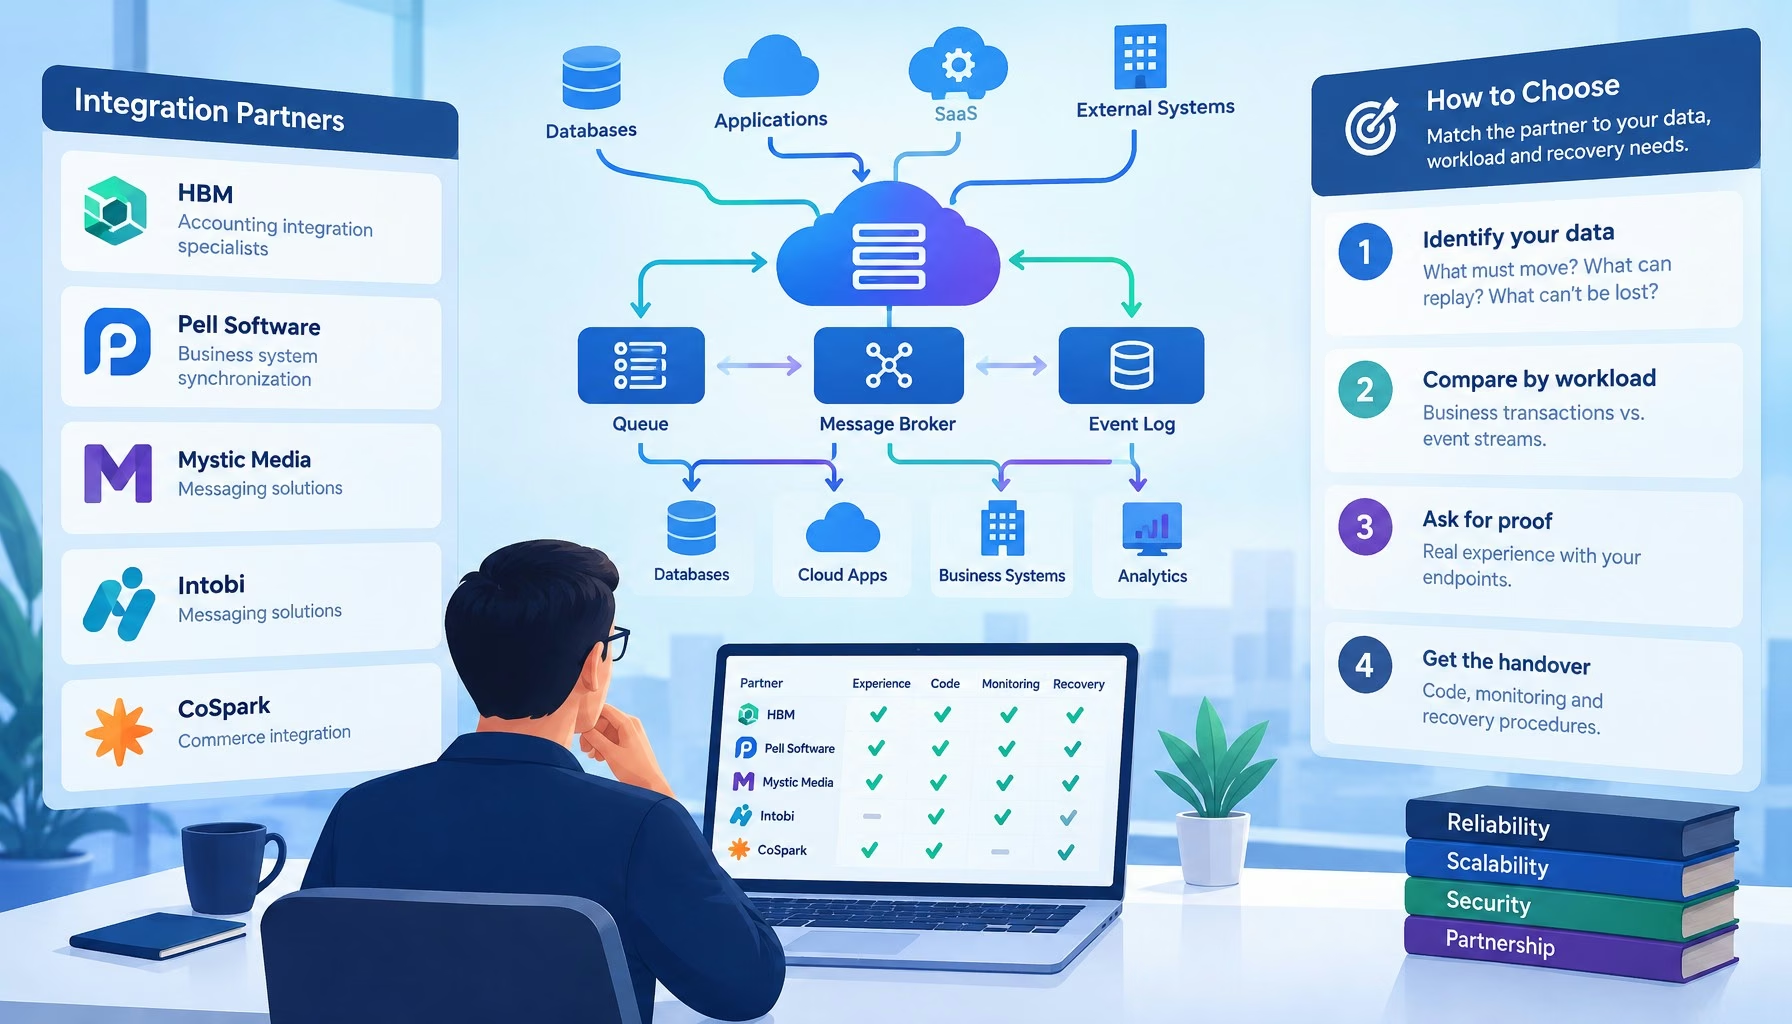
Technical architecture diagram and decision framework for choosing an integration partner for data pipelines: service bus, brokers, and azure-native middleware compared
Choosing an Integration Partner for Data Pipelines: Service Bus, Brokers, and Azure-Native Middleware Compared
Development Exclusive
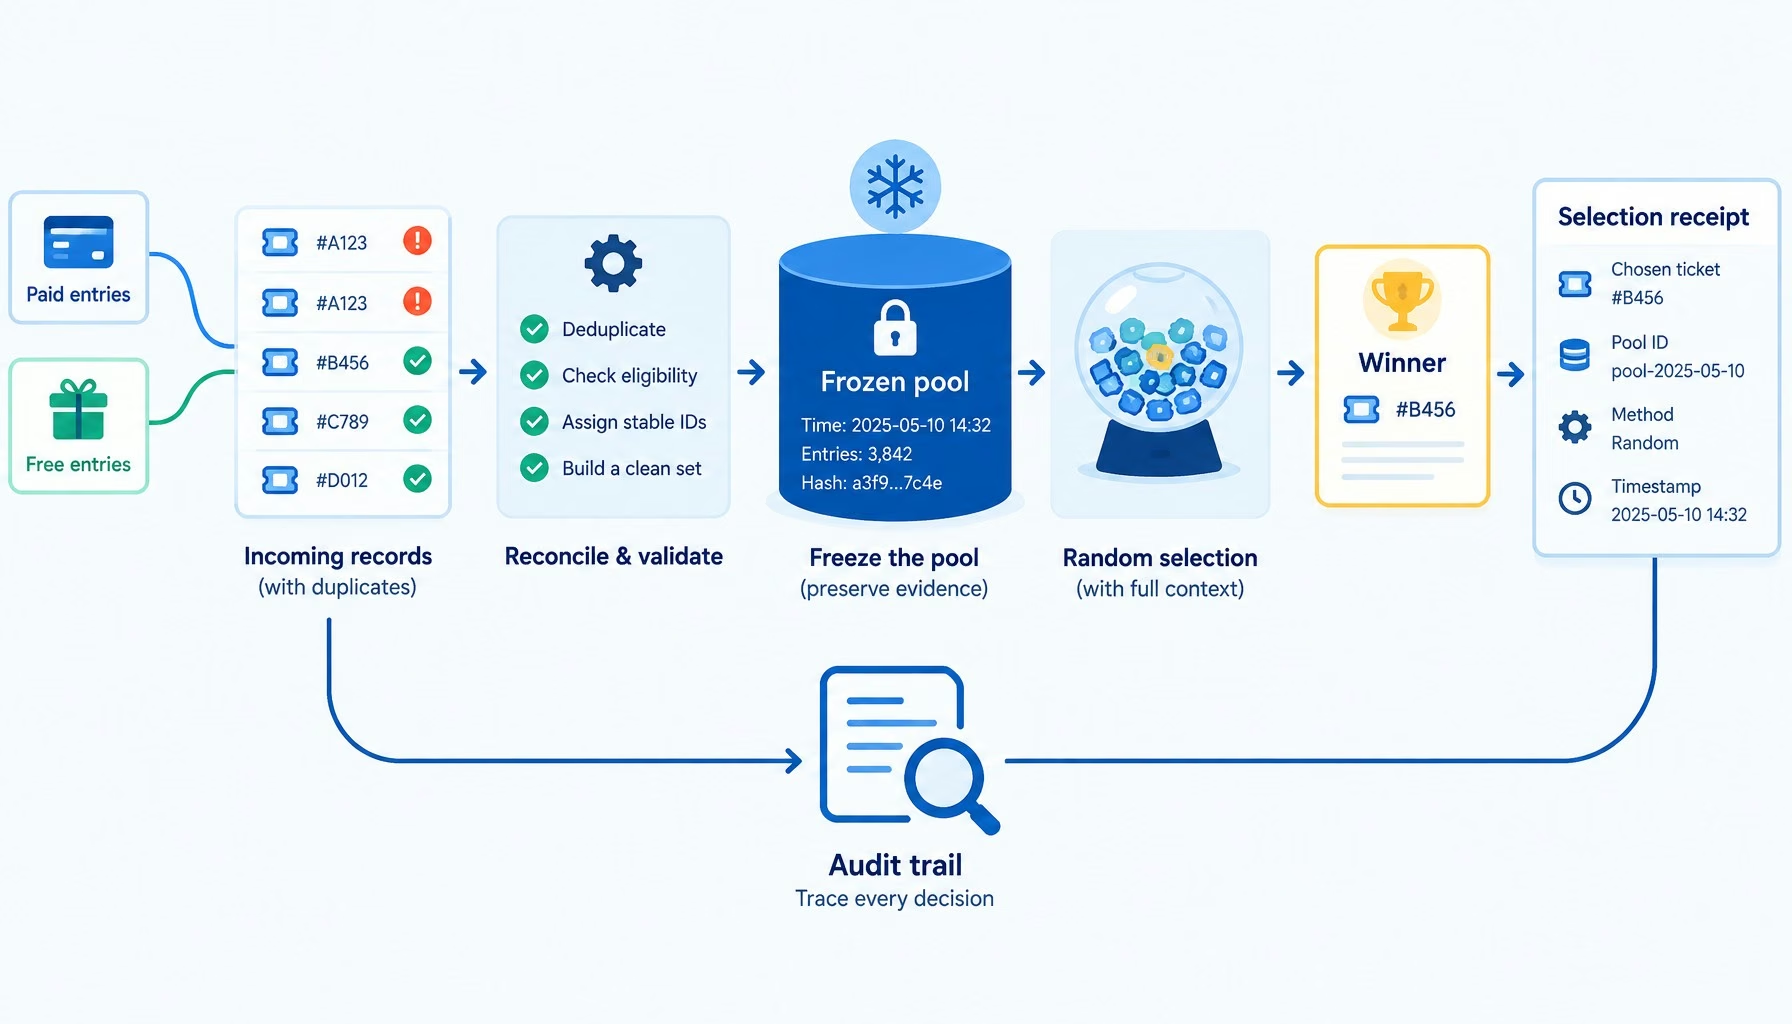
Technical architecture diagram and decision framework for data engineering for prize draws: building an audit trail
Data Engineering for Prize Draws: Building an Audit Trail
Big Data
Technical architecture diagram and decision framework for the trouble with ai that won’t leave a job unfinished
The Trouble With AI That Won’t Leave a Job Unfinished
Artificial Intelligence News
Technical architecture diagram and decision framework for ai-powered logo generation: design.com vs looka
AI-Powered Logo Generation: Design.com vs Looka
Artificial Intelligence Exclusive

Stay Connected

1.2KFollowersLike
33.7KFollowersFollow
222FollowersPin

You Might also Like

Image
Big Data

Government’s Big Data Affected by Shutdown

3 Min Read
how big data helps business
Big Data

How Data Virtualization Benefits Companies

8 Min Read
Comparing Data Science and Analytics [INFOGRAPHIC]
AnalyticsBig DataData ManagementJobsUnstructured Data

Comparing Data Science and Analytics [INFOGRAPHIC]

3 Min Read
Social Data and Mobile Diminishing the Significance of the Resume
Big DataJobsSocial DataSocial Media AnalyticsWorkforce Data

Social Data and Mobile Diminishing the Significance of the Resume

4 Min Read

SmartData Collective is one of the largest & trusted community covering technical content about Big Data, BI, Cloud, Analytics, Artificial Intelligence, IoT & more.

Chatbots and SEO: How Can Chatbots Improve Your SEO Ranking?
Artificial Intelligence Chatbots Exclusive
5 Great Tips for Using Data Analytics for Website UX
Big Data

Quick Link

  • About
  • Contact
  • Privacy
Follow US
© 2008-26 SmartData Collective. All Rights Reserved.
Welcome Back!

Sign in to your account

Username or Email Address
Password

Lost your password?