

We use cookies, including third-party cookies from Google to serve personalized ads through AdSense, to operate this site and understand how it is used. By continuing to browse, you accept this use. See our Privacy Policy and Terms of Use for details, including how to opt out of personalized advertising.
Accept
SmartData CollectiveSmartData Collective
  • Analytics
    AnalyticsShow More
    What Kind of Problem-Solving Distinguishes Data Analysts From Software Engineers -- AI-generated illustration
    What Kind of Problem-Solving Distinguishes Data Analysts From Software Engineers
    7 Min Read
    chatgpt image jul 21, 2026, 04 34 30 pm
    4 Core Benefits of Predictive Maintenance after Vibration Analysis
    10 Min Read
    How Does Data Mining Boost Customer Satisfaction in Logistics? Harnessing Analytics for Results -- AI-generated illustration
    How Does Data Mining Boost Customer Satisfaction in Logistics? Harnessing Analytics for Results
    11 Min Read
    chatgpt image jul 13, 2026, 04 23 45 pm
    How Data Analytics Helps Companies Improve User Engagement
    19 Min Read
    chatgpt image jul 13, 2026, 03 59 46 pm
    How Data Analytics Improves Multi-Location Search Strategies
    10 Min Read
  • Big Data
  • BI
  • Exclusive
  • IT
  • Marketing
  • Software
Search
© 2008-25 SmartData Collective. All Rights Reserved.
Reading: Can Data Visualizations Change the Business Decision Game?
Share
Notification
Font ResizerAa
SmartData CollectiveSmartData Collective
Font ResizerAa
Search
  • About
  • Help
  • Privacy
Follow US
© 2008-23 SmartData Collective. All Rights Reserved.
SmartData Collective > Big Data > Data Visualization > Can Data Visualizations Change the Business Decision Game?
Data Visualization

Can Data Visualizations Change the Business Decision Game?

Brett Stupakevich
Brett Stupakevich
3 Min Read
Can Data Visualizations Change the Business Decision Game?
Photo by Google DeepMind on Pexels (https://www.pexels.com/photo/a-diagram-of-a-model-25626448/)
SHARE

Terrence Kawaja (@tkawaja) of investment firm Luma Partners believes data visualizations can change the business decision game. He began with a simple strategy – make it easier for potential investors to see the path of how advertisers reach consumers. And, offer the content free of charge. The result was the highly popular “LUMAscapes” of the online ad industry.

His infographics, showcased in a recent Wall Street Journal article, represent how more than 1,200 companies fit into display, video, search engine, mobile, social and commerce online advertising. The goal is to show “large, strategic acquirers” including Google, Yahoo and Adobe potential targets for purchase. And, Kawaja helps make the deals.

For example in 2009, Kawaja made sense of the display advertising segment in an infographic that became a go-to tool for advertising executives. Additionally, Kawaja won business as a result of the infographic. According the the WSJ article, he represented online media trader Invite Media during their 2010 Google acquisition.

This mini case study in how one company is using data visualizations to change the investing game is an excellent example for data analytics professionals. Here are four takeaways you can gain from Kawaja’s strategy:

More Read

Is Your Company Ready to Deploy Business Intelligence Intelligently?
Top 3 Ways FP&A Analytics Can Get Your Financial House in Order
Data Modeling Tools: 14 Picks Compared by Modeling Layer in 2026
Cloud Computing’s RAIC? What’s that?
Five Ways Self-Service Data Prep Empowers Excel Users

Data visualizations are the ultimate content marketing. The simplification of complex data in a visually appealing format can take your information and brand viral. Giving away data on the major players and how they work together to drive an industry set the stage for authority and respect. On a side note, much of the commentary on the WSJ article called this data invaluable. However, the article has been shared nearly 300 times on Facebook and Twitter and the infographics have thousands of views on Slideshare.net. You be the judge.

Data visualizations can become an industry standard. Simply look at how Kawaja was able to help ad executives navigate the digital ad space.

Data visualizations can become a game-changer. Kawaja is branding these tools and using the graphics as a tool in generating business for his investment firm.

Data visualizations can be central to business decision-making. According to the WSJ, these new visualizations could enhance discussions at the Digital Media Summit, a meeting of top execs from the investment and Internet advertising space.

What next: To learn how to develop your own enhanced visualizations designed to influence business decision-making check out our recent complimentary webcast titled  “What’s New with Spotfire version 3.3″.

Amanda Brandon
Spotfire Blogging Team
Share This Article
Facebook Pinterest LinkedIn
Share

Follow us on Facebook

Latest News

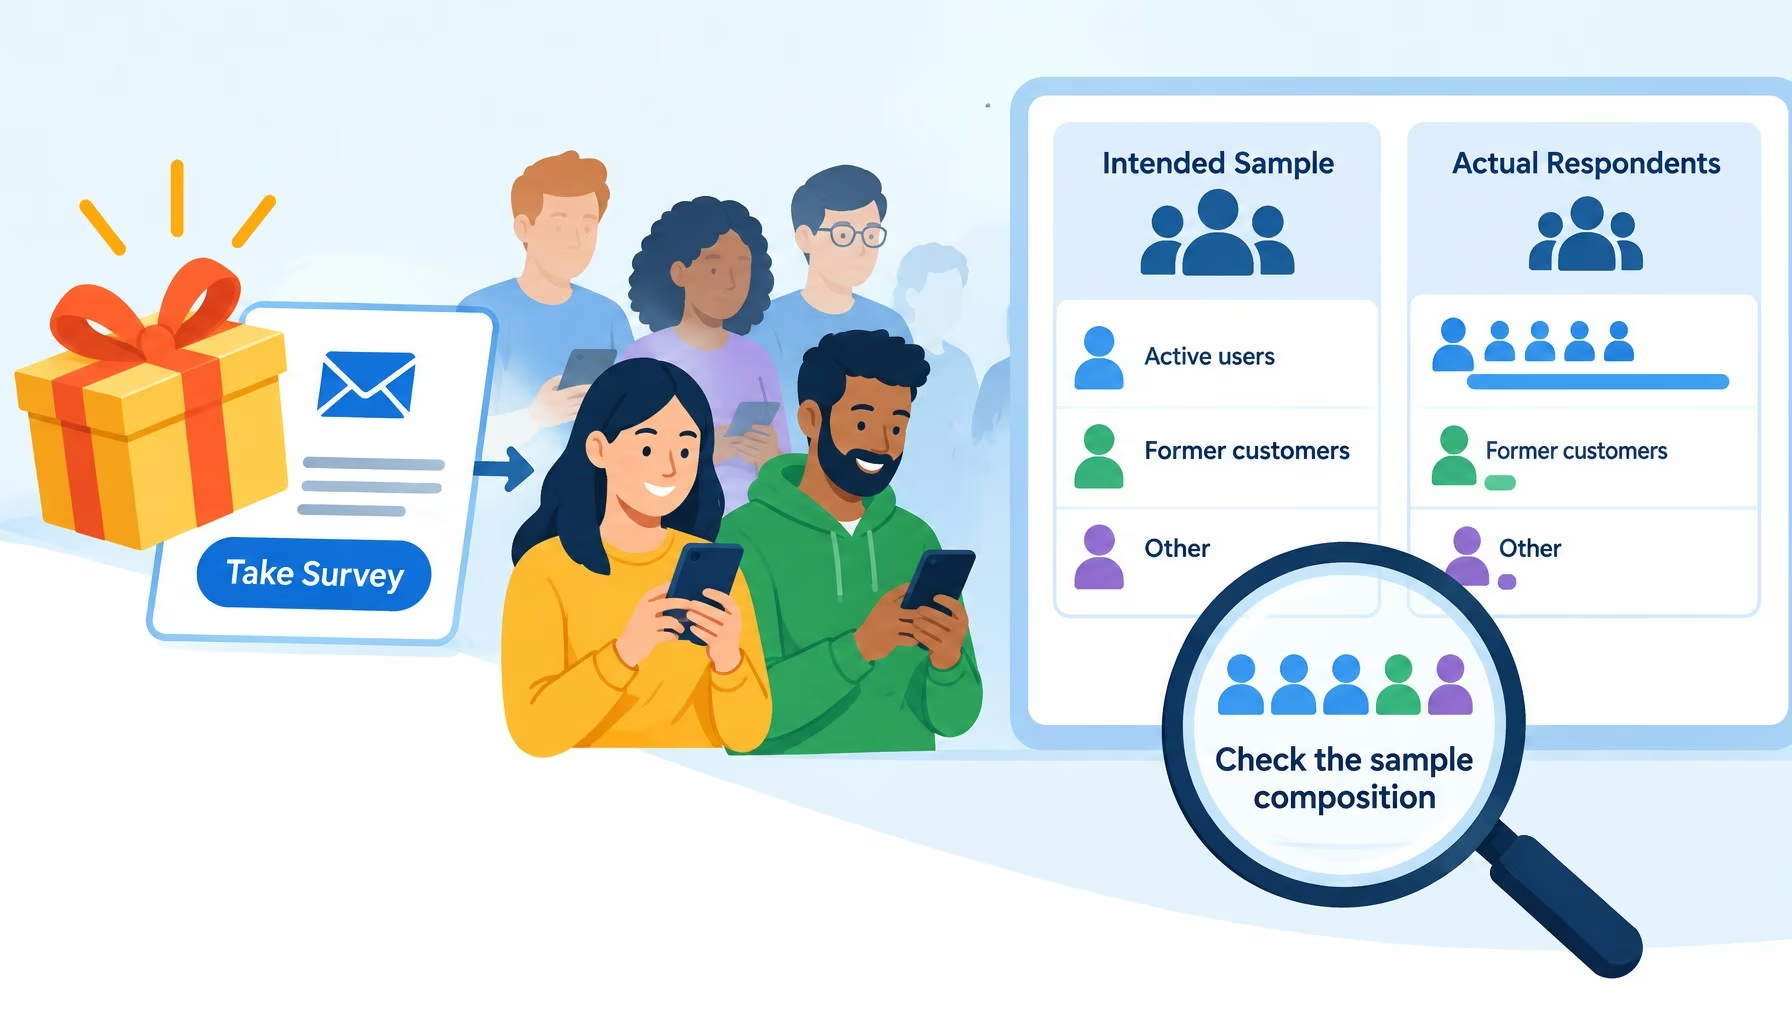
Flat editorial illustration: A guaranteed reward can raise participation while skewing the respondent pool toward active customer
Incentive-Driven Response Bias: Auditing Sample Composition Before You Trust Survey Data
Big Data Data Quality Exclusive
Flat editorial illustration: The article’s core relationship is observable blockchain activity becoming a trustworthy business me
Blockchain Dashboards Need Better Definitions, Not More Charts
Blockchain Exclusive
Flat editorial illustration: The article's core relationship is workload-by-workload decision-making for cloud migration, where s
Which Workloads Should Move to the Cloud?
Cloud Computing Exclusive IT
Flat editorial illustration: The article positions data governance as a strategic board-level concern rather than a purely techni
Why Data Governance Is Becoming a Board-Level Business Priority
Big Data Exclusive Policy and Governance

Stay Connected

1.2KFollowersLike
33.7KFollowersFollow
222FollowersPin

You Might also Like

What’s the Difference? – A Social Media Monitoring Strategy that Analyzes Intentions Instead of Mentions
AnalyticsData VisualizationMarket ResearchPredictive AnalyticsSentiment Analytics

What’s the Difference? – A Social Media Monitoring Strategy that Analyzes Intentions Instead of Mentions

4 Min Read
NCAA Data Visualizer for March Madness Face-Offs
AnalyticsData MiningData VisualizationModelingPredictive AnalyticsR Programming LanguageStatistics

NCAA Data Visualizer for March Madness Face-Offs

2 Min Read
Assisted Insight: The Future of Data Discovery
Business IntelligenceData ManagementData Visualization

Assisted Insight: The Future of Data Discovery

7 Min Read
Big Data Q&A for the Data Protection Law and Policy Newsletter
AnalyticsCulture/LeadershipData VisualizationData WarehousingPolicy and GovernancePrivacy

Big Data Q&A for the Data Protection Law and Policy Newsletter

13 Min Read

SmartData Collective is one of the largest & trusted community covering technical content about Big Data, BI, Cloud, Analytics, Artificial Intelligence, IoT & more.

From Bolts to Bots: How AI Is Fortifying the Automotive Industry
Artificial Intelligence
The Art of Conversation: Enhancing Chatbots with Advanced AI Prompts
Chatbots

Quick Link

  • About
  • Contact
  • Privacy
Follow US
© 2008-26 SmartData Collective. All Rights Reserved.
Welcome Back!

Sign in to your account

Username or Email Address
Password

Lost your password?