
We use cookies, including third-party cookies from Google to serve personalized ads through AdSense, to operate this site and understand how it is used. By continuing to browse, you accept this use. See our Privacy Policy and Terms of Use for details, including how to opt out of personalized advertising.
Accept
SmartData CollectiveSmartData Collective
  • Analytics
    AnalyticsShow More
    Flat editorial illustration: The article connects AI and marketing analytics with managerial judgment grounded in consumer behavi
    How an Online MBA in Marketing Connects AI and Data Analytics
    11 Min Read
    What Kind of Problem-Solving Distinguishes Data Analysts From Software Engineers -- AI-generated illustration
    What Kind of Problem-Solving Distinguishes Data Analysts From Software Engineers
    7 Min Read
    chatgpt image jul 21, 2026, 04 34 30 pm
    4 Core Benefits of Predictive Maintenance after Vibration Analysis
    10 Min Read
    How Does Data Mining Boost Customer Satisfaction in Logistics? Harnessing Analytics for Results -- AI-generated illustration
    How Does Data Mining Boost Customer Satisfaction in Logistics? Harnessing Analytics for Results
    11 Min Read
    chatgpt image jul 13, 2026, 04 23 45 pm
    How Data Analytics Helps Companies Improve User Engagement
    19 Min Read
  • Big Data
  • BI
  • Exclusive
  • IT
  • Marketing
  • Software
Search
© 2008-25 SmartData Collective. All Rights Reserved.
Reading: Smart Cities Turn Big Data Into Insight [INFOGRAPHIC]
Share
Notification
Font ResizerAa
SmartData CollectiveSmartData Collective
Font ResizerAa
Search
  • About
  • Help
  • Privacy
Follow US
© 2008-23 SmartData Collective. All Rights Reserved.
SmartData Collective > Big Data > Smart Cities Turn Big Data Into Insight [INFOGRAPHIC]
Big DataInfographic

Smart Cities Turn Big Data Into Insight [INFOGRAPHIC]

Datafloq
Datafloq
1 Min Read
Smart Cities Turn Big Data Into Insight [INFOGRAPHIC]
Illustrative image generated with OpenAI gpt-image-1.
SHARE

Cities around the globe are confronted with growing populations, aging infrastructure, reduced budgets, and the challenge of doing more with less. Applying big data technologies within cities can provide valuable insights that can keep a city habitable.

Cities around the globe are confronted with growing populations, aging infrastructure, reduced budgets, and the challenge of doing more with less. Applying big data technologies within cities can provide valuable insights that can keep a city habitable. The City of Songdo is a great example of a connected city, where all connected devices create a smart city that is optimized for the every-changing conditions in that same city. IBM recently released an infographic showing the vast opportunities of smart cities and the possible effects on the economy.
Infographic Smarter Cities. Turning Big Data into Insight


Post written by Mark van Rijmenam

More Read

Overcoming the Big Data Skills Gap: The State of the Labor Market
Hadoop Data Mining Tools Can Enhance The Value Of Digital Assets
The Viability of Big Data [INFOGRAPHIC]
The Information Is Already There—Making It Understandable Is the Hard Part
Adapting to Winds of Change


TAGGED:infographic
Share This Article
Facebook Pinterest LinkedIn
Share

Follow us on Facebook

Latest News

Flat editorial illustration: The article connects AI and marketing analytics with managerial judgment grounded in consumer behavi
How an Online MBA in Marketing Connects AI and Data Analytics
Analytics Artificial Intelligence Big Data Exclusive
Flat editorial illustration: The article connects commercial drone capture with integrated software workflows that organize and r
Drone Technology as a Business Investment: Calculating ROI, Costs, and Long-Term Value
Business Intelligence Marketing Software
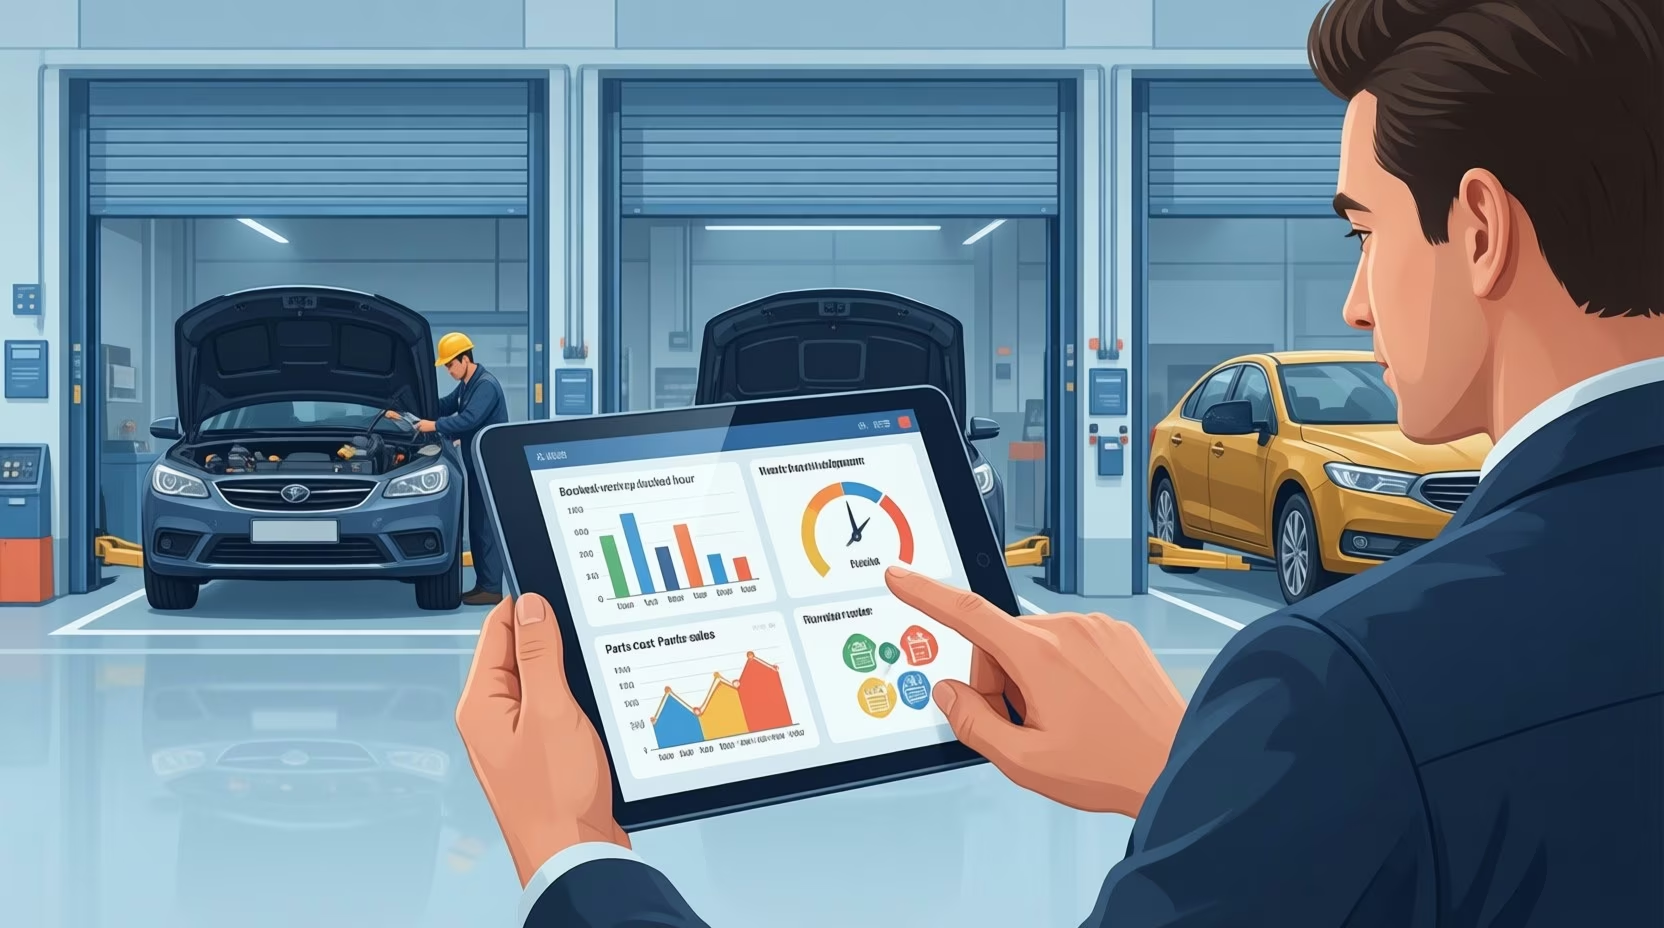
Flat editorial illustration: The article connects weekly technician productivity and related shop metrics to timely scheduling an
Workforce Analytics for Auto Repair Shops: Reading Technician Productivity Weekly
Business Intelligence Exclusive
Flat editorial illustration: A business-editorial depiction of two account-growth routes: data-guided targeted advertising and cr
Targeted Ads and Cross-Promotion: Using Audience Segments and Platform Statistics to Grow
Exclusive Social Data

Stay Connected

1.2KFollowersLike
33.7KFollowersFollow
222FollowersPin

You Might also Like

Are You Ready for the Future of the Internet of Things? [INFOGRAPHIC]
Uncategorized

Are You Ready for the Future of the Internet of Things? [INFOGRAPHIC]

2 Min Read
What Data Do the Five Largest Tech Companies Collect? [INFOGRAPHIC]
Big DataCulture/LeadershipData ManagementData MiningInside CompaniesMarket ResearchPolicy and GovernancePrivacySocial DataTransparency

What Data Do the Five Largest Tech Companies Collect? [INFOGRAPHIC]

1 Min Read
Big Data in Retail Industry [INFOGRAPHIC]
AnalyticsBig DataBusiness IntelligenceMarket ResearchMarketingSocial DataWeb Analytics

Big Data in Retail Industry [INFOGRAPHIC]

0 Min Read
Analyze Big Data Effectively and Efficiently: Five Opportunities [INFOGRAPHIC]
AnalyticsBig DataBusiness IntelligenceCRMData ManagementITMarket ResearchMarketingRisk Management

Analyze Big Data Effectively and Efficiently: Five Opportunities [INFOGRAPHIC]

0 Min Read

SmartData Collective is one of the largest & trusted community covering technical content about Big Data, BI, Cloud, Analytics, Artificial Intelligence, IoT & more.

Chatbots and SEO: How Can Chatbots Improve Your SEO Ranking?
Artificial Intelligence Chatbots Exclusive
AI chatbots
AI Chatbots Can Help Retailers Convert Live Broadcast Viewers into Sales!
Chatbots

Quick Link

  • About
  • Contact
  • Privacy
Follow US
© 2008-26 SmartData Collective. All Rights Reserved.
Welcome Back!

Sign in to your account

Username or Email Address
Password

Lost your password?