
We use cookies, including third-party cookies from Google to serve personalized ads through AdSense, to operate this site and understand how it is used. By continuing to browse, you accept this use. See our Privacy Policy and Terms of Use for details, including how to opt out of personalized advertising.
Accept
SmartData CollectiveSmartData Collective
  • Analytics
    AnalyticsShow More
    What Kind of Problem-Solving Distinguishes Data Analysts From Software Engineers -- AI-generated illustration
    What Kind of Problem-Solving Distinguishes Data Analysts From Software Engineers
    7 Min Read
    chatgpt image jul 21, 2026, 04 34 30 pm
    4 Core Benefits of Predictive Maintenance after Vibration Analysis
    10 Min Read
    How Does Data Mining Boost Customer Satisfaction in Logistics? Harnessing Analytics for Results -- AI-generated illustration
    How Does Data Mining Boost Customer Satisfaction in Logistics? Harnessing Analytics for Results
    11 Min Read
    chatgpt image jul 13, 2026, 04 23 45 pm
    How Data Analytics Helps Companies Improve User Engagement
    19 Min Read
    chatgpt image jul 13, 2026, 03 59 46 pm
    How Data Analytics Improves Multi-Location Search Strategies
    10 Min Read
  • Big Data
  • BI
  • Exclusive
  • IT
  • Marketing
  • Software
Search
© 2008-25 SmartData Collective. All Rights Reserved.
Reading: 5 Kinds of Business Analysis Techniques Every Executive Should Know
Share
Notification
Font ResizerAa
SmartData CollectiveSmartData Collective
Font ResizerAa
Search
  • About
  • Help
  • Privacy
Follow US
© 2008-23 SmartData Collective. All Rights Reserved.
SmartData Collective > Data Management > Best Practices > 5 Kinds of Business Analysis Techniques Every Executive Should Know
AnalyticsBest PracticesData Management

5 Kinds of Business Analysis Techniques Every Executive Should Know

andreesa
andreesa
4 Min Read
5 Kinds of Business Analysis Techniques Every Executive Should Know
Illustration generated with Qwen Image.
SHARE

If you’re a business user thinking about analytics, the options can be dizzying. Where do you begin? Here is a list of 5 business analysis techniques to get you started.

  1. Pacing. This type of analysis helps you measure progress against goals. These goals can be based on historical data, industry benchmarks or user defined. The important thing to remember is that progress isn’t necessarily linear. For example, some organizations close 50 percent of their total bookings on the last day of the quarter. Others, plateau towards the end. You need a way of understanding how you’ve done historically (or how your competitors are doing) and measure your current progress against that. Pacing analysis gives you a big-picture overview of your trajectory and progress against goals.

  1. Parts of whole reporting. This will help you understand the moving parts that are helping you reach your goals. If you’re on target for bookings for the quarter, you’ll be able to see which product lines, sales reps, campaigns or other assets are contributing most to that. If, on the other hand, you’re behind, you’ll be able to pinpoint the cause.

  1. Scenario analysis. When faced with a big decision, it often makes sense to consider a worst-case scenario, a best-case scenario and the most likely scenario. This is what scenario analysis does for you. It projects possible future outcomes. You’ll get a view of how these outcomes might occur, for example, if your biggest client has a bad quarter, they might cut out your services to save money, or they might rely even more on you in order to focus on their core competencies. Most likely, they’ll have an okay quarter and nothing will change.

  1. Cohort analysis. Also known as segmentation, this marketing-analysis technique lets you see how people engage with your content or product over time. Say you roll out different versions of your website, and you want to understand how much your millennial audience engaged with the new site versus the old one. Cohort analysis will tell you that. It’s the way to see different usage patterns and the evolution of usage over time.

  1. Correlation. The classic question in this category: what’s the correlation between diapers and beer? The answer is that when a dad goes to the store to pick up diapers, often times he’ll pick up a six-pack. So diaper sales are positively correlated with beer sales. Correlation analysis can help you find these types of unexpected relationships.

Once you have these 5 business analysis techniques in your toolbox, you’ll be able to cover a lot of analytical ground—and have the information you need to make more informed decisions as a result.

Author: Chanu Damarla, Senior Director of Product Management at GoodData. 

(business analytics / shutterstock)
More Read

5 Ways Big Data Is Being Used To Understand COVID-19
Applying Data Analytics to Customer Experience and Service on Social Media
Exploring Technological Horizons with Recorded Future
Improvement Project for Services; Remember You’re Never Really Done
Top Ten Root Causes of Data Quality Problems: Part Three
Share This Article
Facebook Pinterest LinkedIn
Share

Follow us on Facebook

Latest News

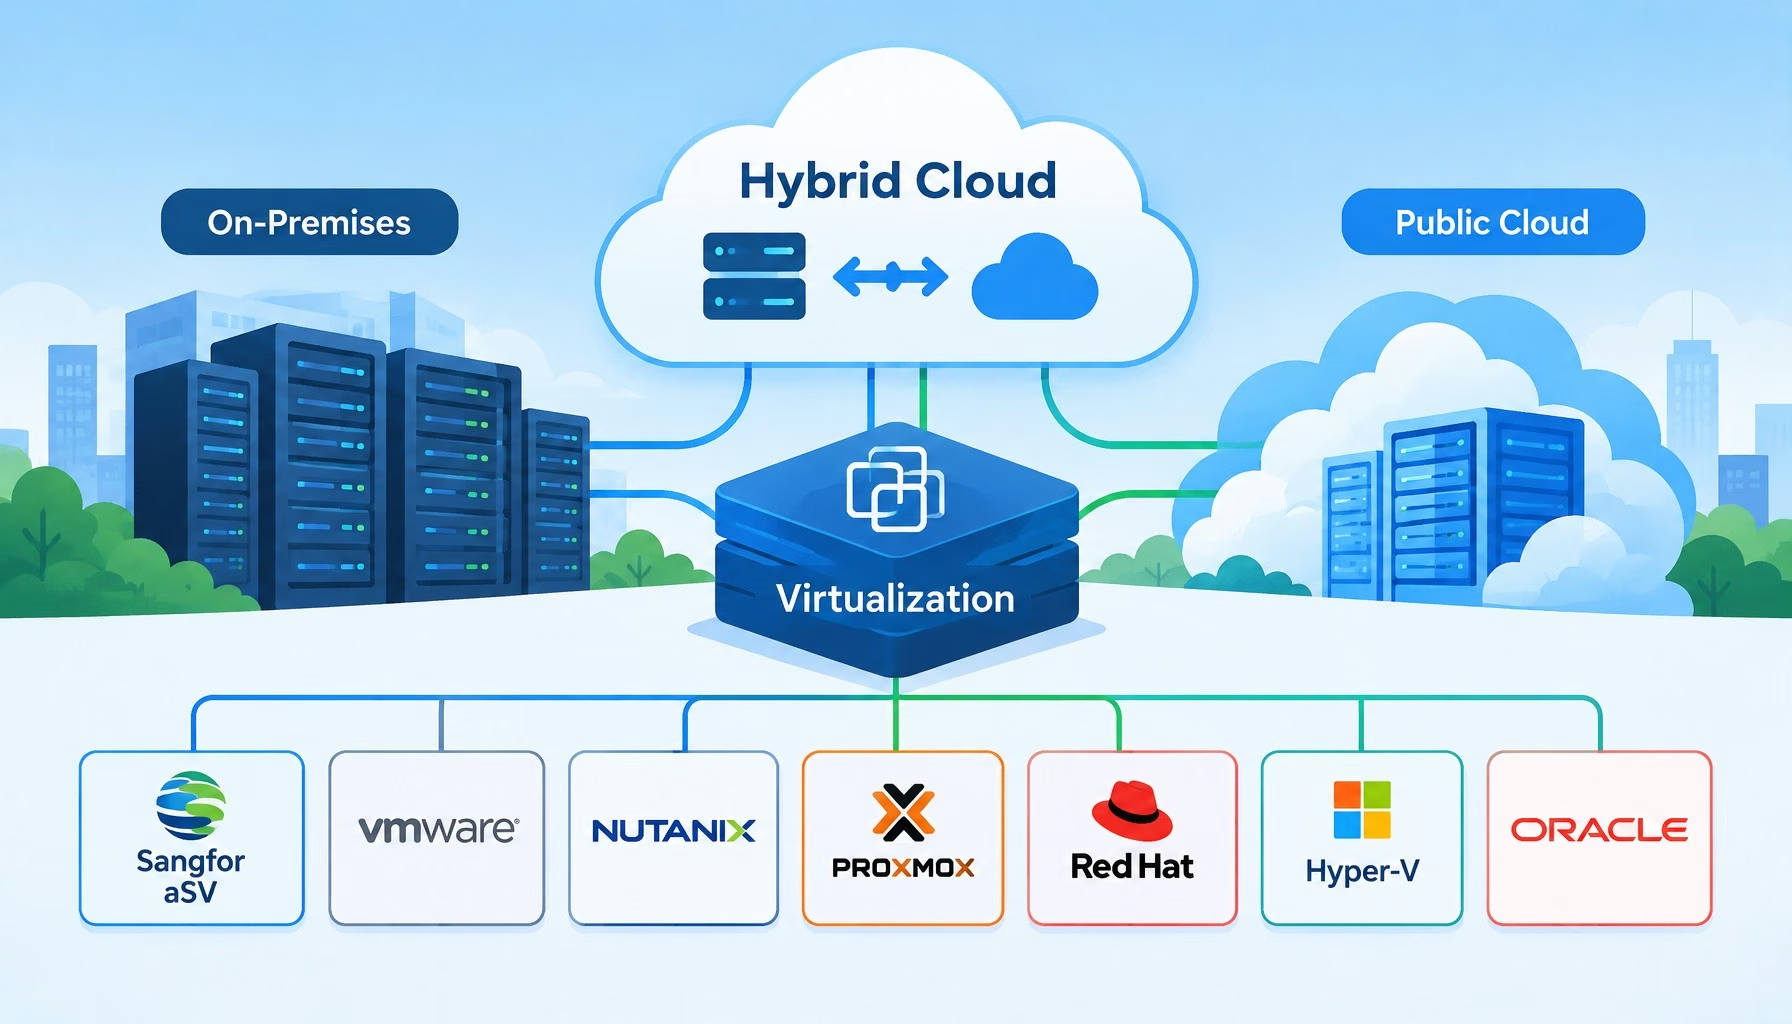
Flat editorial illustration: The article's core relationship is the hypervisor as the abstraction layer that makes hybrid cloud p
7 Best Virtualization Platforms for Hybrid Cloud Environments
Big Data
Flat editorial illustration: The article's core relationship is between aggregated workplace data (occupancy, environmental, feed
How Businesses Can Use Workplace Data to Create Better Office Environments
Big Data Business Intelligence Exclusive
Flat editorial illustration: The article's core relationship is the engineering transition from an AI prototype to a production-r
From AI Prototype to Production: Observability and Scalability Requirements for Data-Heavy SaaS Applications
Artificial Intelligence Exclusive
Preparing Data Systems and Governance for a Scaling Global Gaming Brand -- AI-generated illustration
Preparing Data Systems and Governance for a Scaling Global Gaming Brand
Big Data Infographic

Stay Connected

1.2KFollowersLike
33.7KFollowersFollow
222FollowersPin

You Might also Like

Make Sure Metrics Don’t Kill Your Business
AnalyticsBusiness Intelligence

Make Sure Metrics Don’t Kill Your Business

9 Min Read
Fantasy Football Modeling with R
AnalyticsR Programming Language

Fantasy Football Modeling with R

2 Min Read
Long Term Financial Planning with Financial Data Analytics
Best PracticesCollaborative DataData ManagementData QualityData VisualizationDecision ManagementKnowledge ManagementModelingPredictive Analytics

Long Term Financial Planning with Financial Data Analytics

9 Min Read
How to Increase the Value of Your Social Media Measurement Strategy
AnalyticsSocial DataText Analytics

How to Increase the Value of Your Social Media Measurement Strategy

4 Min Read

SmartData Collective is one of the largest & trusted community covering technical content about Big Data, BI, Cloud, Analytics, Artificial Intelligence, IoT & more.

5 Great Tips for Using Data Analytics for Website UX
Big Data
From Bolts to Bots: How AI Is Fortifying the Automotive Industry
Artificial Intelligence

Quick Link

  • About
  • Contact
  • Privacy
Follow US
© 2008-26 SmartData Collective. All Rights Reserved.
Welcome Back!

Sign in to your account

Username or Email Address
Password

Lost your password?