We use cookies, including third-party cookies from Google to serve personalized ads through AdSense, to operate this site and understand how it is used. By continuing to browse, you accept this use. See our Privacy Policy and Terms of Use for details, including how to opt out of personalized advertising.
Accept
SmartData CollectiveSmartData Collective
  • Analytics
    AnalyticsShow More
    Flat editorial illustration: The article connects AI and marketing analytics with managerial judgment grounded in consumer behavi
    How an Online MBA in Marketing Connects AI and Data Analytics
    11 Min Read
    What Kind of Problem-Solving Distinguishes Data Analysts From Software Engineers -- AI-generated illustration
    What Kind of Problem-Solving Distinguishes Data Analysts From Software Engineers
    7 Min Read
    chatgpt image jul 21, 2026, 04 34 30 pm
    4 Core Benefits of Predictive Maintenance after Vibration Analysis
    10 Min Read
    How Does Data Mining Boost Customer Satisfaction in Logistics? Harnessing Analytics for Results -- AI-generated illustration
    How Does Data Mining Boost Customer Satisfaction in Logistics? Harnessing Analytics for Results
    11 Min Read
    chatgpt image jul 13, 2026, 04 23 45 pm
    How Data Analytics Helps Companies Improve User Engagement
    19 Min Read
  • Big Data
  • BI
  • Exclusive
  • IT
  • Marketing
  • Software
Search
© 2008-25 SmartData Collective. All Rights Reserved.
Reading: Exploratory Analysis with Excel
Share
Notification
Font ResizerAa
SmartData CollectiveSmartData Collective
Font ResizerAa
Search
  • About
  • Help
  • Privacy
Follow US
© 2008-23 SmartData Collective. All Rights Reserved.
SmartData Collective > Big Data > Exploratory Analysis with Excel
Big Data

Exploratory Analysis with Excel

Alex.Matthew
Alex.Matthew
5 Min Read
Exploratory Analysis with Excel
Illustration generated with FLUX.2 [klein 4B] via Cloudflare Workers AI.
SHARE

When it comes to data science, we often find that people first start out learning using Microsoft Excel.  Inevitably, as students progress, Excel starts to appear quaint as they transition to more powerful systems like R or Python. After a while, however, a lot of people end up coming back and realizing that maybe Excel isn’t so bad after all. 

Although data scientists sometimes look down their nose at Excel, we’ve put together a tutorial, along with data scientist David Taylor, that shows that you can do a suprising amount of complex analysis just using basic Excel fucntions. 

We set out to to prove this by walking folks through an analysis of baby names from California based on the United States Social Security Baby Names Database. The Social Security database, which goes back to 1880, has some weird and wonderful anomalies.

For example, David uncovered an interesting (and bizarre) trend of boys’ first names ending in the letter “n” during the latter half of the 20th century.  This is reflected in the provided GIF, which also covers the tragic rise and fall of the letter “d.”  “N”s truly meteoric ascent is one of many fun, and telling, insights that can uncovered through applying some simple Excel functions to a large data set. 

More Read

Informatica's Master Data Management Strategy
Informatica’s Master Data Management Strategy
What Tools Do You Need To Manage Unstructured Data?
How to Develop a Big Data Strategy to Outperform Your Competitors
Dashboard Gauges: Indulgence with Restraint
Big Brother… or do I mean Big Data?

Also, if you explore the names, you’ll notice a trend that impacts girls names far more than boys: a quick rise from obscurity to popularity, then as the name becomes too trendy, a descent to obscurity again.  With boys, you generally see more steady patterns (like the letter “n” at the end of names). Look up names like Mason, Ethan and Jayden, you’ll see them all rise from obscurity to prominence in the 2000s, and many of them are just starting to dip again as of 2013.

Did you know that babies only started routinely having social security numbers starting in 1986? You can see this in the data too. For example, a baby would be much more likely to have the name “Peter” on his official documents than the nickname “Pete”. But if, when a young man or older filled out a tax return or applied for Social Security, he would be more likely to use the name he went by in day-to-day life, which might be a nickname he’d been called since he was a boy.

Finally, as one would expect from anecdotal experience, there is more diversity in names now than there was fifty years ago. In addition, female names are more diverse than male names. Perhaps parents want their girls to stand out more? The changes in diversity track pretty closely between the sexes. This suggests that the difference is due to something intrinsic to the difference between girls’ and boys’ names, not momentary trends. Perhaps the explanation is simple: there is more diversity in girls’ names because there are more spelling variations in girls’ names, like ‘Ann’ and ‘Anne’ and ‘Anna’.

All of these insights were uncovered using intermediate Excel functions like pivot tables, pivot charts, ratios, and filters. We hope this tutorial will help beginners (and experienced data scientists alike) learn some basic steps to take when they first confront a huge chunk of data and want to do some exploratory analysis.  

Share This Article
Facebook Pinterest LinkedIn
Share

Follow us on Facebook

Latest News

Flat editorial illustration: The article links specialist ecommerce SEO agency evaluation to joined-up organic and paid search da
Choosing an Ecommerce SEO Agency When Search Data Drives the Decision
Big Data Exclusive
Flat editorial illustration: The article’s core relationship is that restoring a refrigeration system does not establish trustwor
After the Cyberattack, Can You Trust the Machine?
Artificial Intelligence News
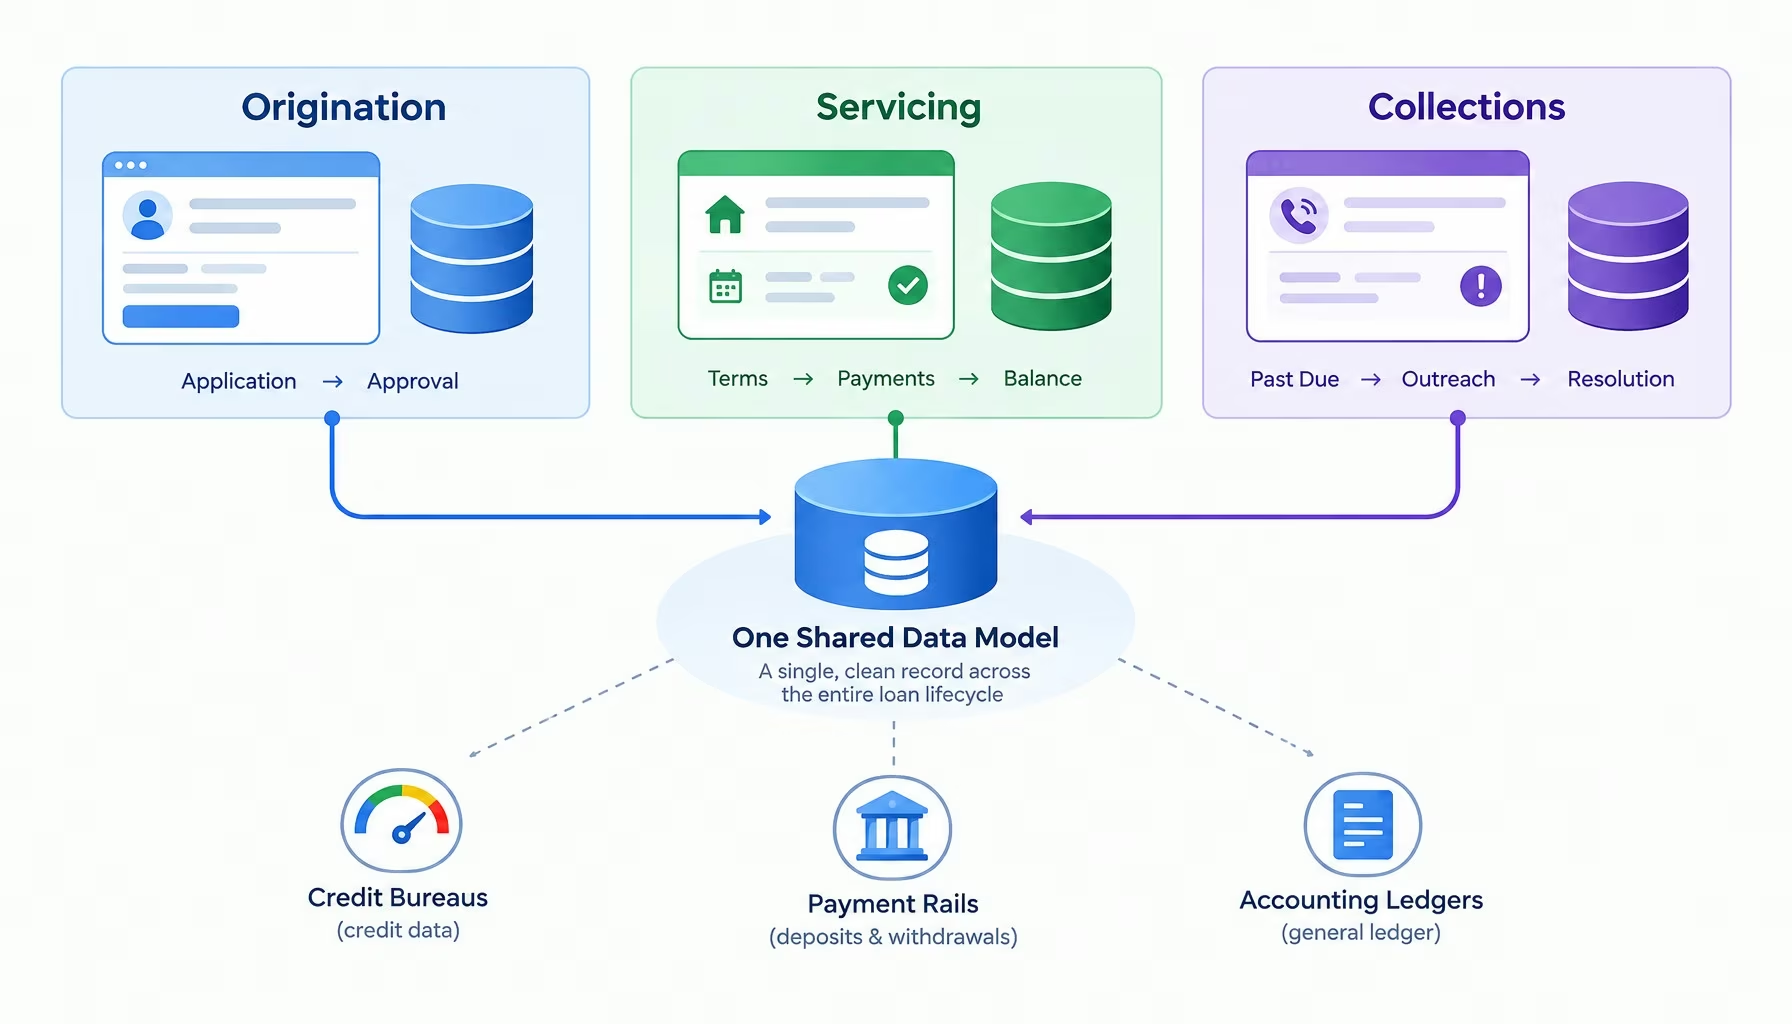
Flat editorial illustration: A technology-editorial comparison of disconnected origination, servicing, and collections records dr
The Data Reconciliation Problem Inside Disconnected Lending Systems
Big Data Exclusive Fintech
Flat editorial illustration: The article connects AI and marketing analytics with managerial judgment grounded in consumer behavi
How an Online MBA in Marketing Connects AI and Data Analytics
Analytics Artificial Intelligence Big Data Exclusive

Stay Connected

1.2KFollowersLike
33.7KFollowersFollow
222FollowersPin

You Might also Like

Email Marketers Use Data Analytics for Optimal Customer Segmentation
Analytics

Email Marketers Use Data Analytics for Optimal Customer Segmentation

12 Min Read
Offsite HIPAA Data Centers Are Key to Health Organization Disaster Recovery
Best PracticesBig DataData ManagementITLocationPolicy and GovernanceSecurity

Offsite HIPAA Data Centers Are Key to Health Organization Disaster Recovery

5 Min Read
How Big Data And AI Are Driving The CBD Gummies Industry
Artificial IntelligenceBig DataExclusive

How Big Data And AI Are Driving The CBD Gummies Industry

8 Min Read
Big Data Analytics Has Potential to Massively Disrupt the Stock Market
Analytics

Big Data Analytics Has Potential to Massively Disrupt the Stock Market

8 Min Read

SmartData Collective is one of the largest & trusted community covering technical content about Big Data, BI, Cloud, Analytics, Artificial Intelligence, IoT & more.

How To Get An Award Winning Giveaway Bot
Big Data Chatbots Exclusive
Chatbots and SEO: How Can Chatbots Improve Your SEO Ranking?
Artificial Intelligence Chatbots Exclusive

Quick Link

  • About
  • Contact
  • Privacy
Follow US
© 2008-26 SmartData Collective. All Rights Reserved.
Welcome Back!

Sign in to your account

Username or Email Address
Password

Lost your password?