We use cookies, including third-party cookies from Google to serve personalized ads through AdSense, to operate this site and understand how it is used. By continuing to browse, you accept this use. See our Privacy Policy and Terms of Use for details, including how to opt out of personalized advertising.
Accept
SmartData CollectiveSmartData Collective
  • Analytics
    AnalyticsShow More
    chatgpt image jul 21, 2026, 04 34 30 pm
    4 Core Benefits of Predictive Maintenance after Vibration Analysis
    10 Min Read
    How Does Data Mining Boost Customer Satisfaction in Logistics? Harnessing Analytics for Results -- AI-generated illustration
    How Does Data Mining Boost Customer Satisfaction in Logistics? Harnessing Analytics for Results
    11 Min Read
    chatgpt image jul 13, 2026, 04 23 45 pm
    How Data Analytics Helps Companies Improve User Engagement
    19 Min Read
    chatgpt image jul 13, 2026, 03 59 46 pm
    How Data Analytics Improves Multi-Location Search Strategies
    10 Min Read
    cybersecurity efforts
    How Behavioral Analytics and AI Are Redefining Cybersecurity for Boca Raton Businesses
    14 Min Read
  • Big Data
  • BI
  • Exclusive
  • IT
  • Marketing
  • Software
Search
© 2008-25 SmartData Collective. All Rights Reserved.
Reading: Missed It By That Much
Share
Notification
Font ResizerAa
SmartData CollectiveSmartData Collective
Font ResizerAa
Search
  • About
  • Help
  • Privacy
Follow US
© 2008-23 SmartData Collective. All Rights Reserved.
SmartData Collective > Uncategorized > Missed It By That Much
Uncategorized

Missed It By That Much

JimHarris
JimHarris
6 Min Read
Missed It By That Much
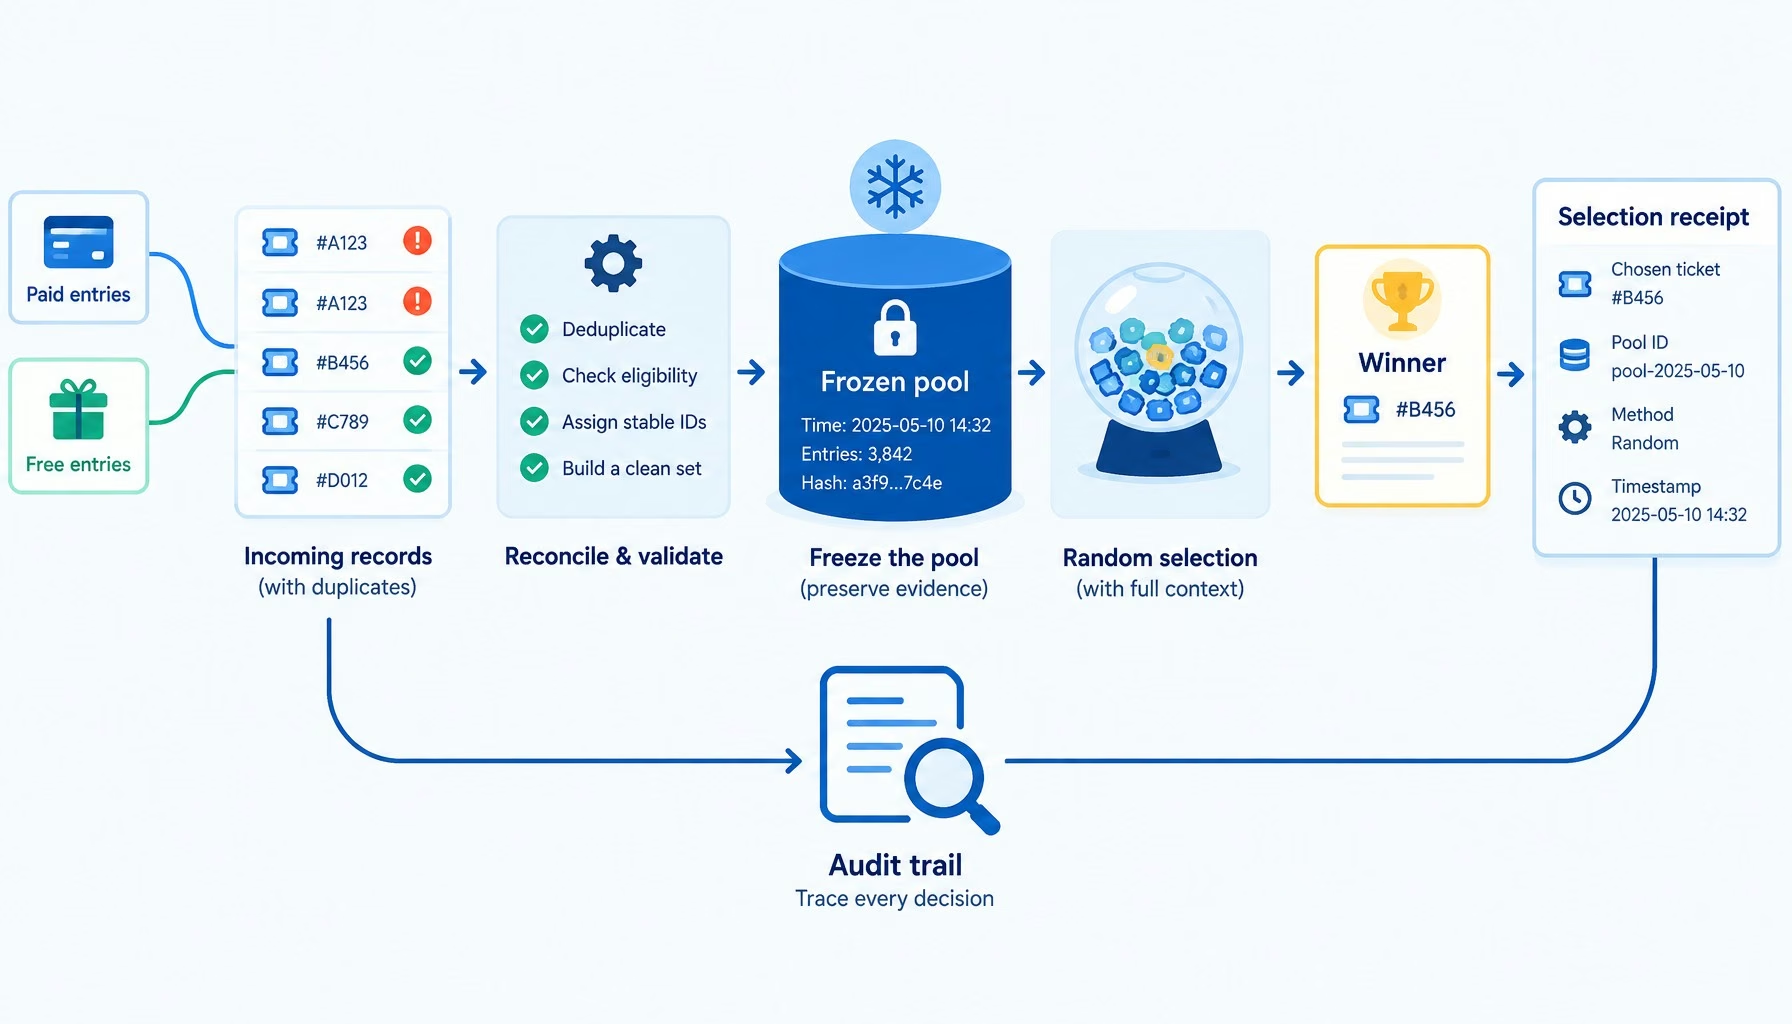
Illustration generated with FLUX.2 [klein 4B] via Cloudflare Workers AI.
SHARE

In the mission to gain control over data chaos, a project is launched in order to implement a new system to help remediate the poor data quality that is negatively impacting decision-critical enterprise information. 

The project appears to be well planned. Business requirements were well documented. A data quality assessment was performed to gain an understanding of the data challenges that would be faced during development and testing. Detailed architectural and functional specifications were written to guide these efforts.

The project appears to be progressing well. Business, technical and data issues all come up from time to time. Meetings are held to prioritize the issues and determine their impact. Some issues require immediate fixes, while other issues are deferred to the next phase of the project. All of these decisions are documented and well communicated to the end-user community.

Expectations appear to have been properly set for end-user acceptance testing.

More Read

Resource Mistakes, Part I
Business Is Winning the BI Battle, but Should It Be a Battle?
IoT Field Notes: How Do People Start?
How Big Data and Analytics Are Changing Football
Marketing a book, country by country

As a best practice, the new system was designed to identify and report exceptions when they occur. The end-users agreed that an obsessive-compulsive quest to find and fix every data quality problem is a laudable pursuit but ultimately a self-defeating cause. Data quality problems can be very insidious and even the best data remediation process will still produce exceptions.

Although all of this is easy to accept in theory, it is notoriously difficult to accept in practice.

Once the end-users start reviewing the exceptions, their confidence in the new system drops rapidly. Even after some enhancements increase the number of records without an exception from 86% to 99% – the end-users continue to focus on the remaining 1% of the records that are still producing data quality exceptions.

Would you believe this incredibly common scenario can prevent acceptance of an overwhelmingly successful implementation?

How about if I quoted one of the many people who can help you get smarter than by only listening to me?

In his excellent book Why New Systems Fail: Theory and Practice Collide, Phil Simon explains:

“Systems are to be appreciated by their general effects, and not by particular exceptions…

Errors are actually helpful the vast majority of the time.”

In fact, because the new system was designed to identify and report errors when they occur:

“End-users could focus on the root causes of the problem and not have to wade through hundreds of thousands of records in an attempt to find the problem records.”

I have seen projects fail in the many ways described by detailed case studies in Phil Simon’s fantastic book. However, one of the most common and frustrating data quality failures is the project that was so close to being a success but the focus on exceptions resulted in the end-users telling us that we “missed it by that much.”

I am neither suggesting that end-users are unrealistic nor that exceptions should be ignored. 

Reducing exceptions (i.e., poor data quality) is the whole point of the project and nobody understands the data better than the end-users. However, chasing perfection can undermine the best intentions. 

In order to be successful, data quality projects must always be understood as an iterative process. Small incremental improvements will build momentum to larger success over time. 

Instead of focusing on the exceptions – focus on the improvements. 

And you will begin making steady progress toward improving your data quality.

And loving it!


Related Posts

The Data Quality Goldilocks Zone

Schrödinger’s Data Quality

The Nine Circles of Data Quality Hell
TAGGED:data quality
Share This Article
Facebook Pinterest LinkedIn
Share

Follow us on Facebook

Latest News

Illustration of mobile analytics dashboards with ad performance charts connected to backend databases
11 Best Sisense Alternatives for Embedded Analytics
Business Intelligence Exclusive
Analyst points at colorful circular data dashboard on screen - information technology business metrics
How Fragmented Workplace Tech Undermines Reliable Business Metrics and Reporting
Cloud Computing Exclusive Infographic IT
Using Multi-Source Data and Analytics to Detect Operational Drift Across Franchise Networks -- AI-generated illustration
Using Multi-Source Data and Analytics to Detect Operational Drift Across Franchise Networks
Exclusive Infographic
Beyond The First Impression: The Long-Lasting Impact Of Sensory Marketing -- AI-generated illustration
Beyond The First Impression: The Long-Lasting Impact Of Sensory Marketing
Infographic Marketing

Stay Connected

1.2KFollowersLike
33.7KFollowersFollow
222FollowersPin

You Might also Like

The Great Rift
Data Quality

The Great Rift

7 Min Read
The Big Question In Big Data Is...What's The Question?
AnalyticsBest PracticesBig DataBusiness IntelligenceCollaborative DataData ManagementData MiningData QualityData VisualizationData WarehousingDecision ManagementPredictive AnalyticsSentiment AnalyticsSocial DataSocial Media AnalyticsSoftwareStatisticsText AnalyticsUnstructured DataWeb AnalyticsWorkforce AnalyticsWorkforce Data

The Big Question In Big Data Is…What’s The Question?

7 Min Read
The Fragility of Knowledge
Uncategorized

The Fragility of Knowledge

5 Min Read
Sun Tzu and the Art of Data Quality
Uncategorized

Sun Tzu and the Art of Data Quality

6 Min Read

SmartData Collective is one of the largest & trusted community covering technical content about Big Data, BI, Cloud, Analytics, Artificial Intelligence, IoT & more.

ai chatbot
How AI Website Chatbots Improve Customer Support and Lead Generation
Chatbots Exclusive
Chatbots and SEO: How Can Chatbots Improve Your SEO Ranking?
Artificial Intelligence Chatbots Exclusive

Quick Link

  • About
  • Contact
  • Privacy
Follow US
© 2008-26 SmartData Collective. All Rights Reserved.
Welcome Back!

Sign in to your account

Username or Email Address
Password

Lost your password?